Figure 4.
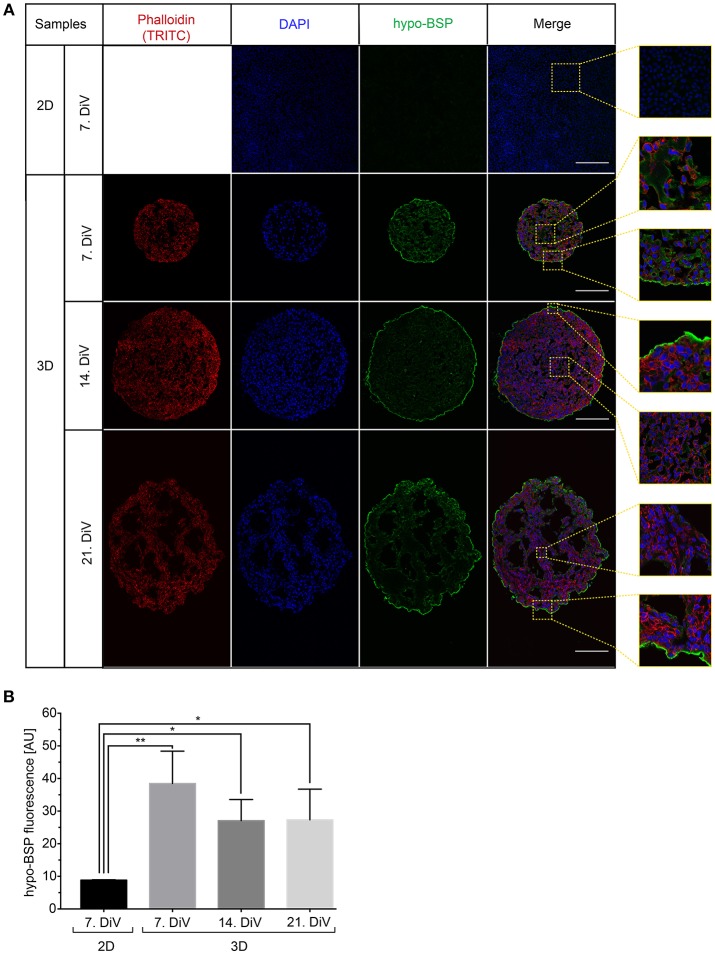
Upregulation of BSP protein levels in young SM3 MDA-MB-231 spheroids is confirmed by immunofluorescence analysis. (A) 2D cell cultures were stained with DAPI (blue, cell nuclei) and hypo-BSP antibody (green). Ten micrometer thick cryosections of 7, 14, and 21. DiV spheroids were additionally labeled with Phalloidin-TRITC (red, actin cytoskeleton). Scale bars, 200 μm. Large panels depict optical sections, small panels show details from central and border regions of cultures to illustrate the BSP signal intensity and the enrichment of BSP at the spheroid rims. Detail pictures are taken from the dashed squared areas shown in the large panels. (B) Quantitative analysis of confocal images. The graph depicts antibody fluorescence signals as a function of DiV. Statistical analysis was performed with one-way ANOVA followed by Tukey's multiple comparisons test (n = 3 for 2D and n = 4 for 3D; a total of 148 confocal images were analyzed; **P < 0.01, *P < 0.05, mean ± SD).

