Figure 5.
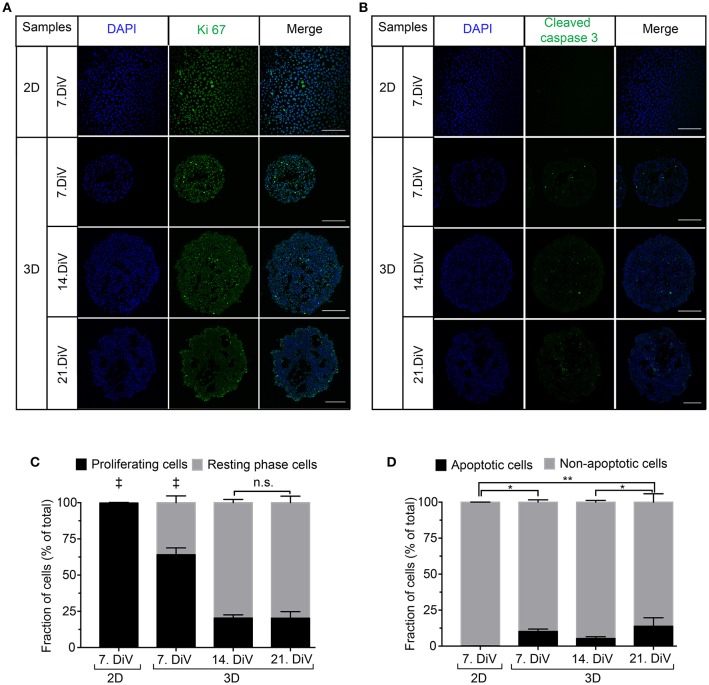
Cell proliferation decreases in MDA-MB-231 spheroids with increasing DiV. (A,B) Monolayer cell culture and 10 μm thick cryosections of 7., 14., and 21. DiV spheroids were stained with DAPI (blue) and immunolabeled for either Ki 67 (A, proliferation marker, green) or Cleaved Caspase 3 (B, apoptosis marker, green). Images show single confocal slices of representative samples. Scale bars, 200 μm. (C,D) Quantitative analysis of confocal images. Statistical analysis was performed with one-way ANOVA followed by Tukey's multiple comparisons test. (C) Graphs depict mean ± SD (n = 3 for 2D and 3D; a total of 85 confocal images were analyzed; ‡ = Significant difference to all other values). (D) Graphs depict mean ± SD (n = 3 for 2D and 3D; a total of 81 confocal images were analyzed; **P < 0.01, *P < 0.05).

