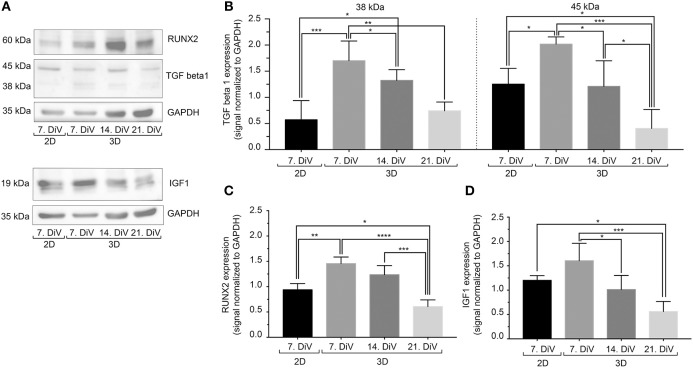
Figure 6.
In untreated SM3 spheroids, expression profiles of TGFβ1, IGF-1, and RUNX2 are similar to that of BSP. Equal amounts of protein of lysates from monolayer cells (2D) as well as 7., 14., and 21. DiV spheroids (3D) were loaded on SDS-PAGE and Western blots were performed. (A) Representative Western blot profiles for TGFβ1, RUNX2, IGF-1, and GAPDH (loading control). (B-D) Quantitative analyses of Western blot bands. Statistical analysis was performed with one-way ANOVA followed by Tukey's multiple comparisons test (n = 4, ****P ≤ 0.0001, ***P < 0.001, **P < 0.01, *P < 0.05, mean ± SD).

