
FIGURE 2.
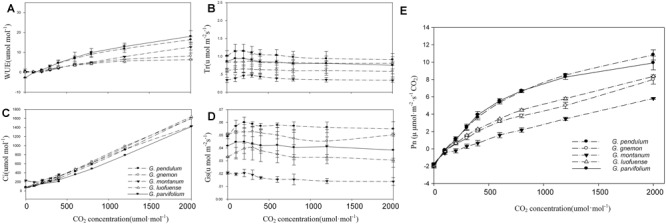
CO2-response curves of five Gnetum species. Y-axes represent five photosynthetic characters (mean values ± standard deviation, n = 3), i.e., (A) photosynthetic rate (Pn), (B) stomatal conductance (Gs), (C) intercellular CO2 concentration (Ci), (D) transpiration rate (Tr), and (E) water use efficiency (WUE). X-axis represents CO2 concentration.