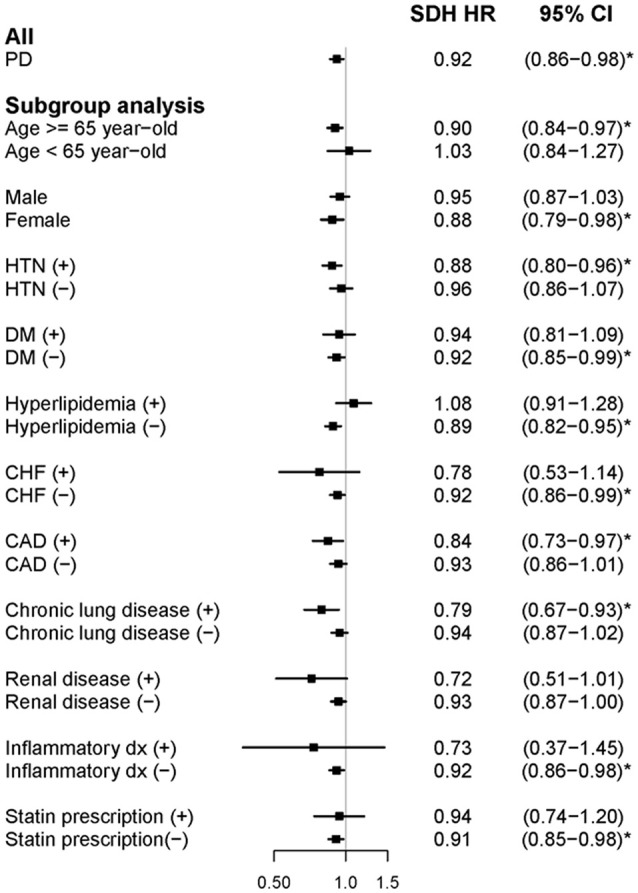
Figure 3.

Forest plot showing the adjusted subdistribution hazard ratio of atrial fibrillation among the participants and subgroup analysis in the cohort study. aSDH HR, adjusted subdistribution hazard ratio; PD, Parkinson's disease; HTN, hypertension; DM, diabetes mellitus; CHF, congestive heart failure; and CAD, coronary heart disease.
