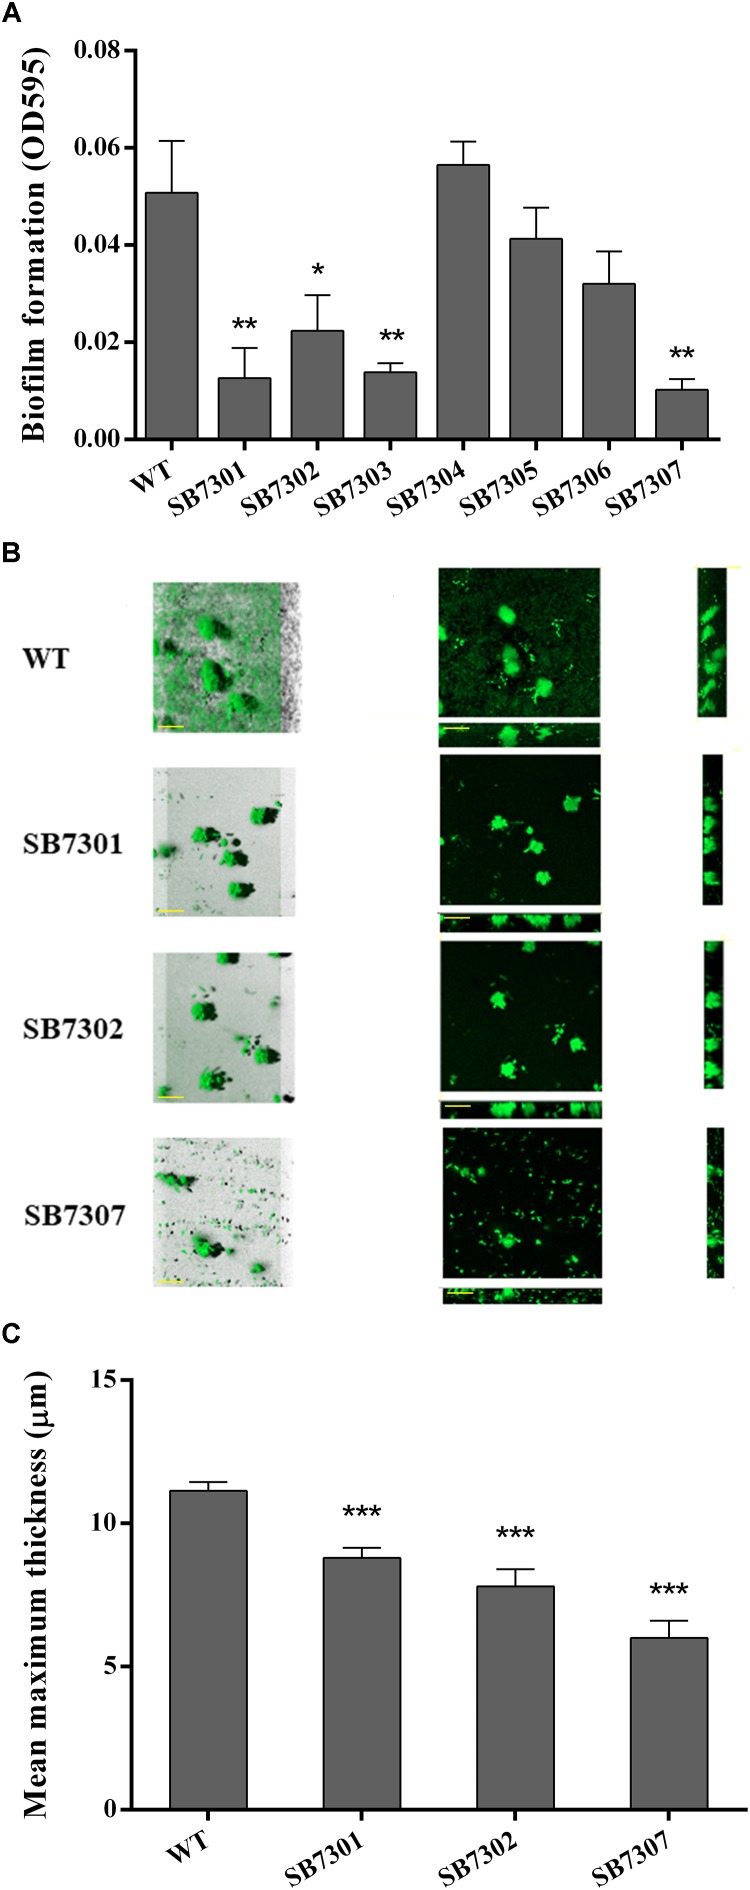
FIGURE 4.
Biofilm formation activity of gene deletion mutants. (A) Biofilm formation of wild-type and each deletion mutant (SB7301, SB7302, SB7303, SB7304, SB7305, and SB7306) strains was quantified by microtiter plate assay. (B) Biofilm formation of wild-type, SB7301 and SB7302 mutant strains was analyzed by CLSM imaging in blend mode view (left panel) and section mode view (right panel). The scale bars represent 50 μm. (C) The mean maximum thickness of biofilms obtained from CLSM imaging. Data was presented as the mean ± standard deviation (n = 3, ∗p < 0.05, ∗∗p < 0.01, ∗∗∗p < 0.001).

