
FIGURE 9.
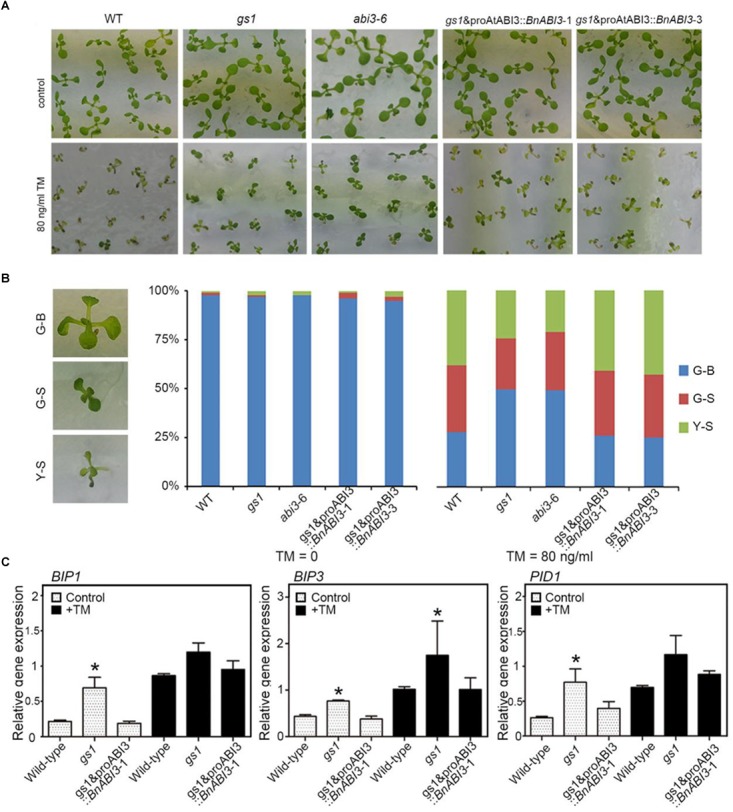
BnABI3 overexpression confers ER stress tolerance. (A) The sensitivity of WT, gs1, and abi3-6 mutant and gs1 and proAtABI3::BnABI3 transgenic plants to ER stress. Photographs of 10-day-old Arabidopsis seedlings grown on MS medium supplied without or with 80 ng/ml tunicamycin (TM) are shown. (B) The percentage of Green-Big (G-B), Green-Small (G-S), and Yellow-Small (Y-S) plants were calculated. The difference between the WT and each transgenic line is shown. Bars depict SD (n = 3). (C) RT-qPCR analysis of BIP1, BIP3, and PID1 expression levels in WT, gs1, and abi3-6 mutant and gs1 and proAtABI3::BnABI3 transgenic plants were either left untreated or exposed to TM. A group of 10 plants was measured for each genotype. Values are given as mean ± SD, n = 3. ∗p < 0.05 by Mann–Whitney test.