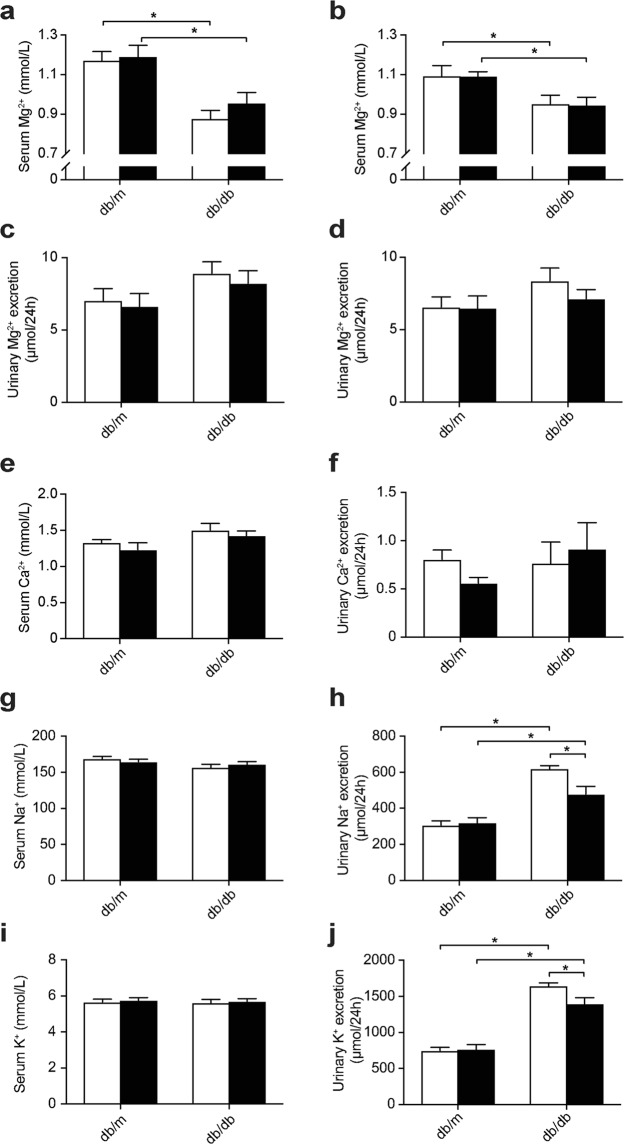
Figure 2.
Db/db mice have a lower serum Mg2+ concentration which is not modulated by metformin treatment. (a) Serum Mg2+ concentration after two weeks of treatment and (b) after four weeks of treatment. (c) 24-Hour urinary Mg2+ excretion after two weeks of treatment (6.8 ± 0.6 vs. 8.6 ± 0.6 µmol/24 h in db/m vs. db/db mice, respectively, two-way ANOVA p ≤ 0.05) and (d) after four weeks of treatment. (e) Serum Ca2+ concentration (1.28 ± 0.05 vs. 1.46 ± 0.06 mmol/L Ca2+ in db/m vs. db/db mice, respectively, two-way ANOVA p ≤ 0.05) and (f) 24-hour urinary Ca2+ excretion, after four weeks of treatment. (g) Serum Na+ concentration (167 ± 2 vs. 159 ± 3 mmol/L Na+ in db/m vs. db/db mice, respectively, two-way ANOVA p ≤ 0.05) and (h) 24-hour urinary Na+ excretion, after four weeks of treatment. (i) Serum K+ concentration and (j) 24-hour urinary K+ excretion, after four weeks of treatment. Open bars, placebo-treated mice; closed bars, metformin-treated mice. Data are mean ± SEM. Depending on the absence or presence of a significant interaction effect between genotype and treatment, either a two-way ANOVA (Tukey’s multiple comparison test) or an unpaired multiple t test (Holm-Sidak multiple comparison test) approach, respectively, was used to determine statistical significance. *Indicates a p ≤ 0.05.

