Figure 1.
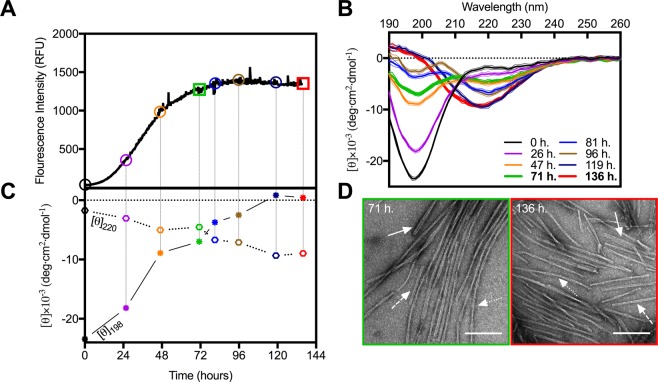
Structural maturation of αSN is not accompanied by noticeable changes in fibril morphology. (A) The fluorescent intensity of ThT (λex/em = 450/480 nm) during αSN in vitro fibrillation. Colored objects indicate the time points at which samples were extracted for SRCD measurements to provide (B) corresponding far-UV CD spectra. (C) Time-dependent conformational changes of αSN during fibrillation monitored at λ198nm (asterisks) and λ220nm (hexagons). (D) Representative TEM images of αSN amyloid fibrils from the early (green) and late (red) phases of the plateau. Solid, dashed and dotted arrows indicate examples of striated ribbon, rod-like and twisted morphologies, respectively. Scale bars represent 200 nm.

