Fig. 1.
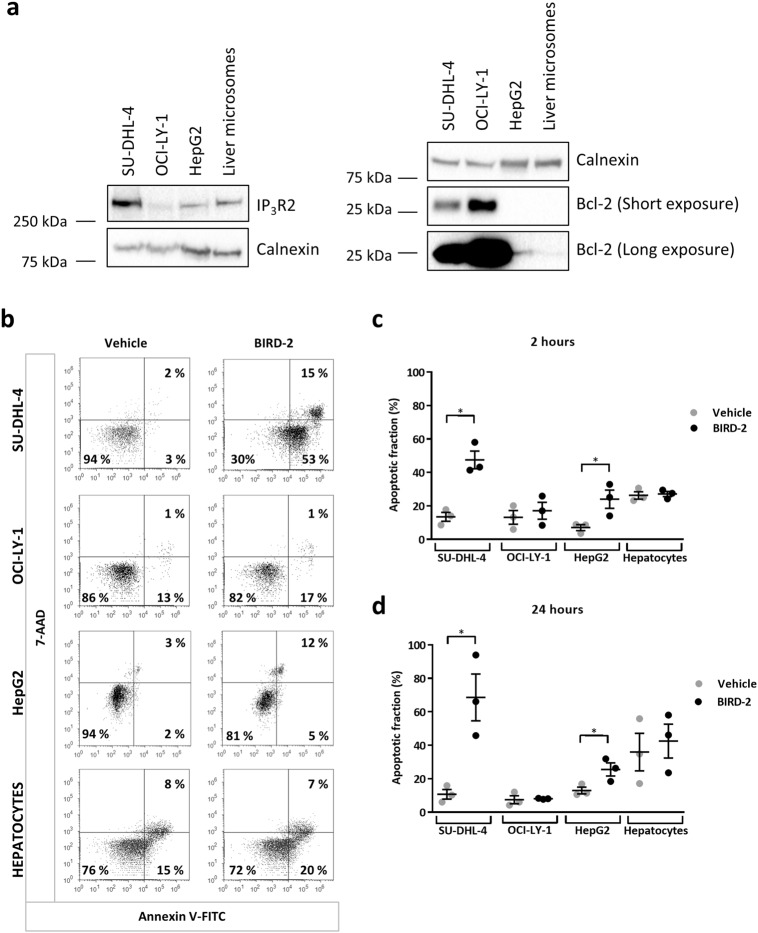
High IP3R2-expression levels are not sufficient per se to render cells sensitive to BIRD-2. a The IP3R2- and Bcl-2-protein levels present in cell lysates from SU-DHL-4 (40 µg), OCI-LY-1 (40 µg), and HepG2 (40 µg) cells and from microsomes extracted from primary hepatocytes (20 µg) were determined by western-blot analysis. The expression level of calnexin was used as a control for equal loading. b Representative dot plots from flow cytometry analysis measuring apoptosis by staining SU-DHL-4, OCI-LY-1, HepG2 cells and primary hepatocytes with Annexin V-FITC and 7-AAD. Cells were treated with vehicle or 10 μM BIRD-2 for 2 h. The dot plots are representative of 3 independent experiments. c, d Quantitative analysis of 3 independent experiments detecting apoptosis in Annexin V-FITC/7-AAD-stained cells treated with vehicle or 10 µM BIRD-2. Apoptotic cell death was measured 2 h (c) and 24 h (d) after BIRD-2 treatment. Data are represented as average ± SEM (N = 3). Statistically significant differences were determined with a Student’s t-test (paired, two-tailed, *P < 0.05) (BIRD-2 versus vehicle)

