Fig. 3.
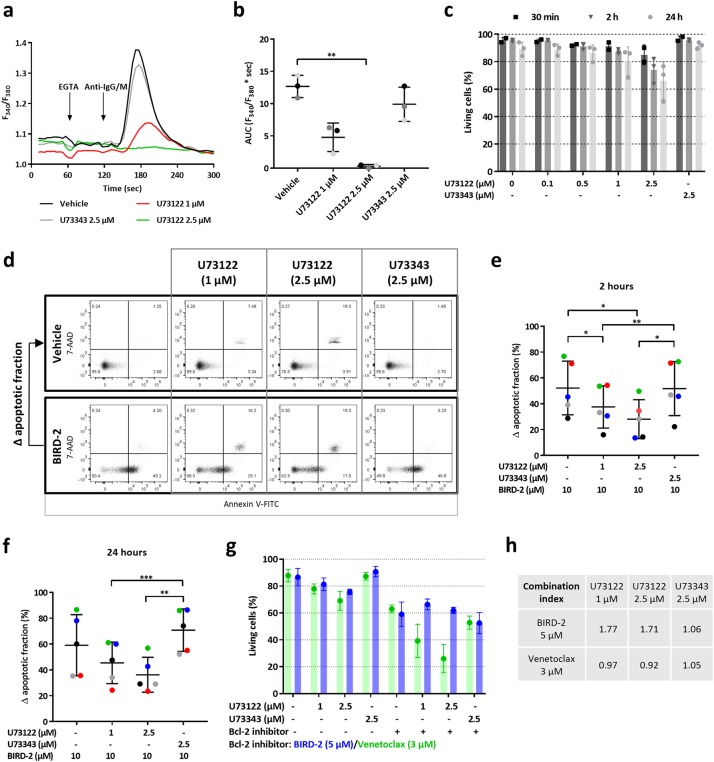
U73122 protects against BIRD-2-triggered apoptosis in SU-DHL-4. a Cell-population analysis of the cytosolic Ca2+ response, measured with Fura-2 AM, in SU-DHL-4 cells pre-treated for 30 min with U73122 (1 and 2.5 µM), U73343 (2.5 µM) or vehicle (DMSO). Addition of 3 mM EGTA and 12 µg/ml anti-IgG/M antibody is indicated by the first and second arrow, respectively. The curves are representative of 3 independent experiments. The cytosolic Ca2+ response after anti-IgG/M addition was quantified by measuring the area under the curve (AUC), which is shown in b. c Quantitative analysis of 3 independent experiments detecting apoptosis in Annexin V-FITC/7-AAD-stained SU-DHL-4 cells. Cells were treated with varying concentrations of U73122 or 2.5 µM U73343. Apoptotic cell death was measured 30 min, 2 h and 24 h after treatment. On the y-axis the percentage of living cells is plotted. Data are shown as the average ± SEM (N = 3). d Representative dot plots from flow cytometry analysis detecting apoptosis in Annexin V-FITC/7-AAD-stained SU-DHL-4 cells treated for 2 h with vehicle or 10 µM BIRD-2. Cells were pre-treated for 30 min with U73122 or U73343. e, f Quantitative analysis of 4 independent experiments detecting apoptosis in Annexin V-FITC/7-AAD-stained SU-DHL-4 cells. Apoptotic cell death was measured as the percentage of Annexin V-FITC-positive cells. Cells were pre-treated with U73122 or U73343 for 30 min. Cell death was measured 2 h (e) and 24 h (f) after BIRD-2 treatment. On the y-axis, the ∆ apoptotic fraction is plotted, which is the difference in apoptosis between the BIRD-2-treated and the vehicle-treated fraction, and between the BIRD-2 + U73122-treated and the U73122-treated fraction, and finally between the BIRD-2 + U73343-treated and the U73343-treated fraction. Data are shown as the average ± SEM (N = 5). g Quantitative analysis of 4 independent experiments detecting apoptosis in Annexin V-FITC/7-AAD-stained SU-DHL-4 cells treated with 1 or 2.5 µM U73122, 2.5 µM U73343, 5 µM BIRD-2 (blue), 3 µM venetoclax (green) or a combination of U73122/U73343 with BIRD-2/venetoclax. For the conditions without Bcl-2 inhibitor (indicated with a ‘-’), the green bars indicate the use of the vehicle control for venetoclax, while the blue bars indicate the use of vehicle control for BIRD-2 treatment. A ‘+’ indicates that the Bcl-2 inhibitor (BIRD-2/venetoclax) was added in this condition. Cell death was measured 24 h after treatment. On the y-axis the percentage of living cells, which corresponds to the Annexin V-FITC- and 7-AAD-negative fraction, is shown. Data are expressed as the average ± SEM (N = 4). h CI derived from SU-DHL-4 cells treated with U73122/U73343 in combination with BIRD-2/venetoclax. The CI was calculated (see Method section) from the data shown in g. Statistically significant differences were determined using an analysis of variance (ANOVA, *P < 0.05, **P < 0.01, ***P < 0.001)

