Fig. 4.
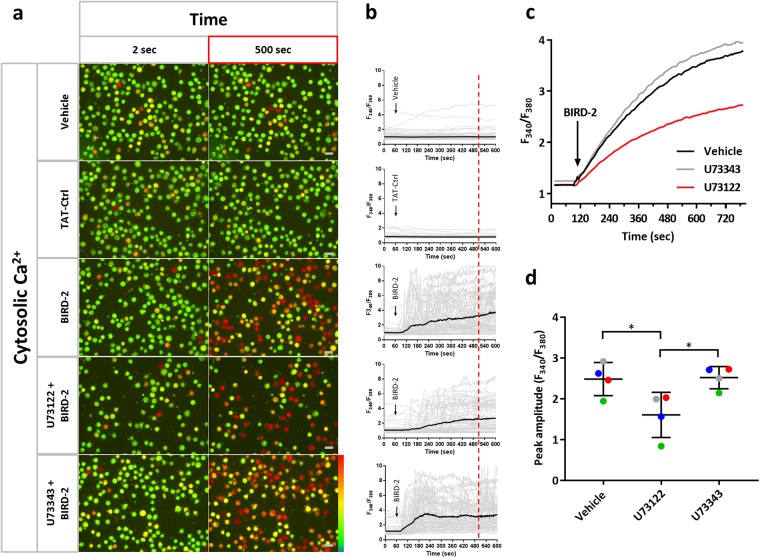
U73122 reduces the BIRD-2-induced cytosolic Ca2+ rise in SU-DHL-4 cells. a Single-cell analysis of the BIRD-2-induced Ca2+ response in SU-DHL-4 cells using the ratiometric Ca2+ indicator Fura-2 AM. Representative pseudo-color images before (2 s) and after (500 s) BIRD-2 treatment are shown. Vehicle and TAT-Ctrl were used as negative control conditions. The pseudo-color scale bar indicates increasing ratio fluorescence. b Single-cell cytosolic Ca2+ signals (gray lines) and their respective mean (black line) upon addition of vehicle, TAT-ctrl peptide or 10 µM BIRD-2 to SU-DHL-4 cells without or with pre-treatment of 1 μM U73122/U73343. c Cell-population analysis of the cytosolic Ca2+ response induced by 10 µM BIRD-2 in SU-DHL-4 cells pre-treated without (black line) or with 1 µM U73122 (green line) or 1 µM U73343 (gray line). The curves are representative of 4 independent experiments. Data were quantified by calculating the peak amplitude (d). In d, data are represented as mean ± SEM (N = 4). Statistically significant differences were determined using an analysis of variance (ANOVA, *P < 0.05)

