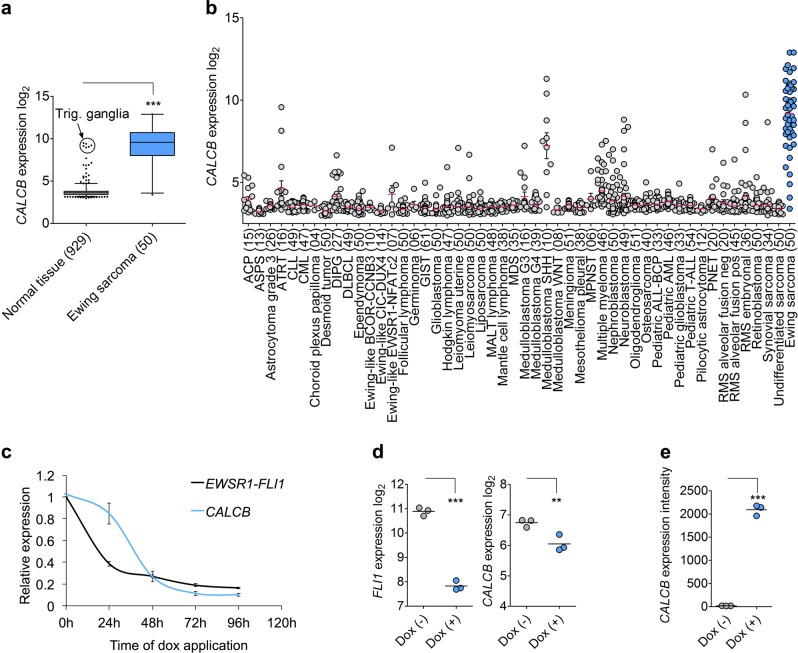
Fig. 1. CALCB is an EWSR1-FLI1 target gene specifically expressed in Ewing sarcoma (EwS).
a Analysis of CALCB expression in EwS (n = 50) and normal tissues (71 tissue types, n = 929 samples). Data are represented as box plots in log2 scale. Horizontal bars indicate median expression levels, boxes the interquartile range. Whiskers indicate the 2.5th and 97.5th percentiles, respectively. Unpaired two-tailed Student’s t test. b Analysis of CALCB expression in EwS (n = 50) and different (pediatric) tumors (49 types, n = 1 699 samples). Publicly available microarray data are represented as dot plots in log2 scale with mean and SEM. Each dot represents one sample. The number of samples is given in parentheses. EwS highlighted in blue color. c Time-course analysis of CALCB and EWSR1-FLI1 expression in A673/TR/shEF1 EwS cell harboring a dox-inducible shRNA against EWSR1-FLI1 by qRT-PCR in vitro after dox application. Given are mean expression levels and SEM (n = 7). d Analysis of CALCB expression in xenografts derived from A673/TR/shEF1 cells with/without dox treatment for 96 h in vivo. Gene expression levels were determined by Affymetrix Clariom D microarrays as previously described29. Expression levels are shown in log2 scale; horizontal bars indicate mean expression level (n = 3); unpaired two-tailed Student’s t test. e Analysis of CALCB expression in a published dataset (GSE64686)40 with ectopic dox-inducible EWSR1-FLI1 expression in human embryoid bodies. Data were generated on Affymetrix HG-U133Plus2.0 microarrays and normalized simultaneously by RMA and brainarray CDF (ENTREZg; v21). Horizontal bars indicate mean expression levels; unpaired two-tailed Student’s t test. **P ≤ 0.01; ***P ≤ 0.001

