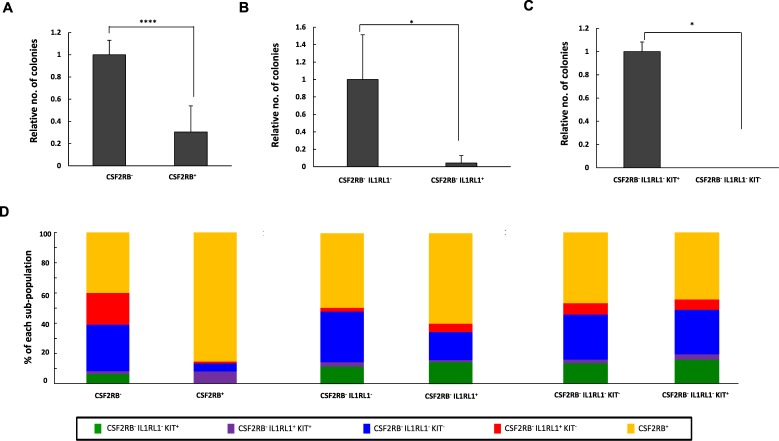
Figure 2.
Colony forming cells are enriched in the CSF2RB−, IL1RL1−, KIT+ population. (A–C) Bar graphs showing the relative number of colonies observed from leukemic cells from 3 independent Cbfb+/56M; Mx1-Cre+ mice sorted for the indicated cell surface markers. (D) Bar graph showing the percentage of each sub-population in colonies observed from leukemic cells from 3 independent Cbfb+/56M; Mx1-Cre+ mice sorted for the indicated cell surface markers. N ≥ 3; *P < 0.05; ****P < 0.0001.

