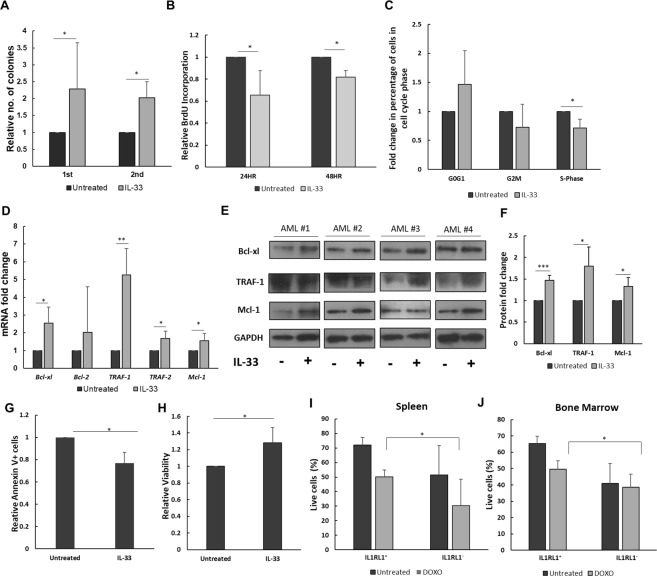
Figure 6.
IL-33 promotes colony formation and survival of primary mouse Cbfb-MYH11+ leukemia cells. (A) Bar graph showing the relative number of colonies observed from equal numbers of Cbfb-MYH11+/56M, Mx1-Cre+ leukemia cells cultured in the presence or absence of IL-33 (100 ng/mL) in methylcellulose. Colonies were scored on day 14 (1st round), and then equal numbers of cells replated in methylcellulose, without additional IL-33 (2nd round). (B) Bar graph showing the relative BrdU incorporation in leukemia cells from Cbfb-MYH11+/56M, Mx1-Cre+ mice after culture for 24 and 48 hours in the presence or absence of IL-33 (100 ng/mL) compared to the untreated. Cells were pulse labeled with BrdU for 1 hour. (C) Bar graph showing the relative percentage of leukemia cells from Cbfb-MYH11+/56M, Mx1-Cre+ mice in the indicated phase of the cell cycle after culture for 24 hours in the presence or absence of IL-33 (100 ng/mL). (D) Bar graph showing the fold changes in mRNA expression of Bcl-xl, Bcl-2, TRAF-1, TRAF-2, and Mcl-1 in leukemia cells from Cbfb-MYH11+/56M, Mx1-Cre+ mice cultured for 6 hours in the presence or absence of IL-33 (100 ng/mL). Relative expression levels were normalized to that of Actb. (E) Representative western blots of Bcl-xl, TRAF-1, Mcl-1, and the loading control GAPDH and (F) bar graph of relative protein levels in leukemia cells from four independent Cbfb-MYH11+/56M, Mx1-Cre+ mice cultured in the presence or absence of IL-33 (100 ng/mL). The membrane was cut into individual blots and incubated with indicated primary antibodies in separate dishes. After detection of Mcl-1, the blot was stripped and probed sequentially with antibody to GAPDH. (G) Bar graph showing the relative Annexin V staining and (H) viability in leukemia cells from Cbfb-MYH11+/56M, Mx1-Cre+ mice after culture for 24 hours in the presence of IL-33 (100 ng/mL) or combined with anti-IL1RL1 antibody (1 µg/mL) compared to the untreated cells. (I) Bar graphs showing the percentage of live cells from spleen and (J) bone marrow within IL1RL1+ and IL1RL1− populations 48 hours after DOXO administration. For full scans of western blots from panel (E) see Supplemental Fig. S11. N ≥ 3; *P < 0.05; **P < 0.01.

