Fig. 1.
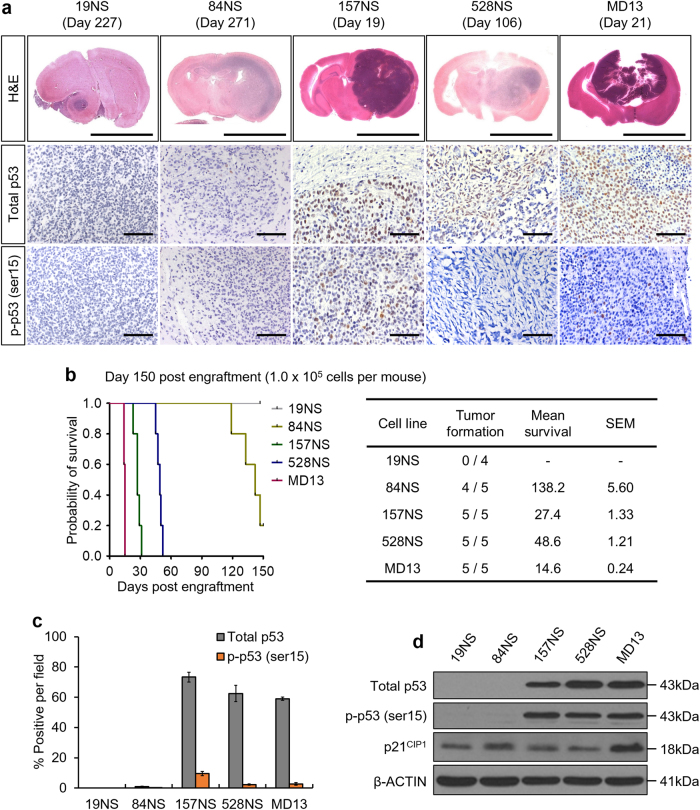
The distinct histological features of patient-derived GBM are associated with p53 expression. a Representative images of H&E staining and IHC. The date displayed above each photo indicates the time of mouse sacrifice. b Tumor forming capacities of patient-derived GBM. A Kaplan–Meier survival plot of mice grafted with the same number of each GBM cell lines (left), and a table displaying the mean overall survival (right). c Quantification of IHC provided in a. d Western blot analysis for total p53, phosphorylated p53 (p-p53, ser15), and p21CIP1. Representative microscopic images of H&E and IHC are magnified 6× (scale bar = 5 mm) and 200× (scale bar = 100 μm), respectively. The bar graph represents the mean ± SEM

