Fig. 4.
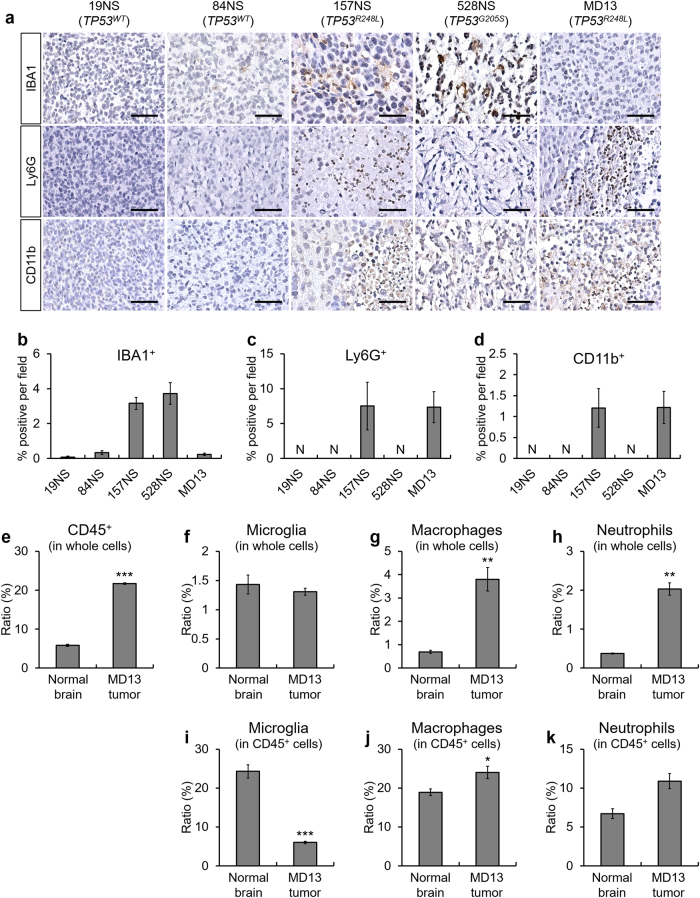
TP53R248L xenograft tumor shows high immune cell population infiltration. a Representative IHC images showing immune cell markers including IBA1, Ly6G, and CD11b. Three mice per cell lines were used except for 19NS. Brain tumor tissue from one mouse was used for 19NS because of its low tumor-forming ability (Fig. 1b). Representative microscope images are magnified 200× (scale bar = 100 μm). b–d Quantification of IHC for the composition of IBA1+, Ly6G+, and CD11b+ immune cells, respectively. e–k Flow cytometry measurement of immune cell composition in the MD13 xenograft brain tumor and normal brain. Dot plots showing the results of the flow cytometry analyses are shown in Supplementary Fig. S5. The bar graphs represent the mean ± SEM. N indicates no detection

