Fig. 2.

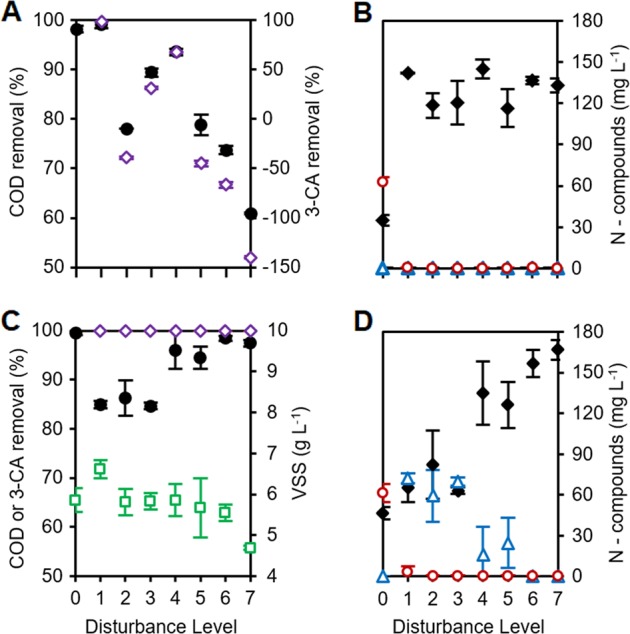
Process performance indicators across disturbance levels. Effects include temporal changes and trade-offs in community function. a, c Percentage of organic carbon as chemical oxygen demand (COD, black circles) and 3-CA (open purple rhombuses) removal for all levels (negative values represent accumulation). c Biomass as volatile suspended solids (VSS, open green squares). b, d Concentration of ammonium (black rhombuses), nitrite (open blue triangles), and nitrate (open red circles) as nitrogen for all levels. Data are from days 7 (a, b) and 35 (c, d) of the study (for all time points sampled, see Supplementary Figure 2). Mean ± s.d. (n = 3) are shown. Undisturbed L0 replicates had consistent organic carbon removal and complete nitrification, whereas press-disturbed L7 never showed nitrification and had the lowest final biomass. Intermediate levels L1–6 displayed changing functionality with higher s.d. values that increased over time
