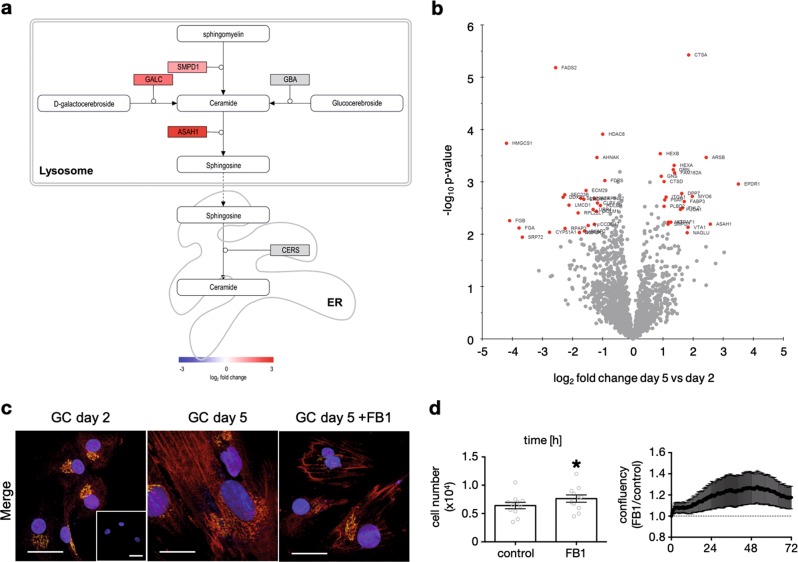
Fig. 4. Proteomic analysis and verification of involvement of the endogenous ceramide system by FB1 blocking experiments.
Levels of ceramide salvage pathway proteins increased during culture in human IVF-derived GCs. a Illustration of enzymatic reactions of ceramide within the salvage pathway in the lysosome, and ceramide synthesis in the endoplasmatic reticulum. Three different molecules get processed enzymatically to ceramide; Sphingomyelin by the acid sphingomyelinase, D-galactocerebroside by galactosylceramidase and glucocerebroside by acid beta-glucosidase. Ceramide then gets turned over by acid ceramidase to sphingosine, which can be processed back to ceramide in the endoplasmatic reticulum61. Proteins in grey were not significantly altered in abundance. Quantified proteins were colored with the shown gradient according to their log2 fold change between day 5 and day 2. b Volcano plot comparing day 5 with day 2 of human GC culture. Red marked proteins differed significantly in abundance after multiple testing correction. Table 2 shows the corresponding log2 fold changes as well as the p values. For each time point 5 GC samples were measured. c GCs, cultured on glass coverslips were fixed on day 2 or day 5 of culture. Cells were also stimulated with fumonisin B1 (FB1, 0.5 µM, 72 h) before fixation. Only merged pictures are shown, separated channels are available in Supplementary Fig. 4a. Immunocytochemical staining using anti-ceramide and anti-golgin97 antibodies revealed different intensities and cellular localization, depending on culture time and stimulation. Controls using rabbit IgG and mouse IgM are shown in inset of the first picture. Two experiments were performed and representative pictures are shown. Scale bars indicate 25 µm. d Cell numbers of GCs that were treated with FB1 (0.5 µM, n = 11) for 72 h are depicted in the bar diagram. On the right side, confluency data of FB1-stimulated stimulated GCs (0.5 µM, n = 6, a) are depicted, which were collected every 20 min and normalized to the corresponding solvent control. Paired Student’s t test was conducted to evaluate statistical significance (*p < 0.05); bars indicate SEM

