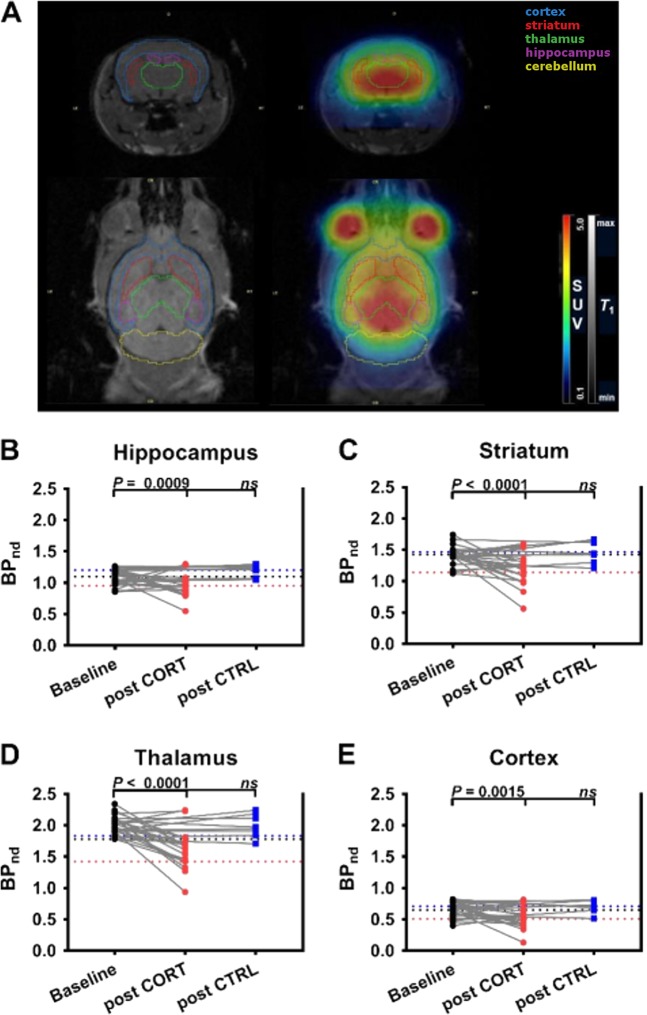
Fig. 2. BPnd values for CORT-treated and control groups.
a Definition of brain ROIs (hippocampus—purple; striatum—red; thalamus—green; cortex—blue; cerebellum—yellow) for subregional analysis of SERT density on representative coronal and horizontal MR and MR co-registered PET summation images (0–90 min). BPnd values at baseline and after treatment with corticosterone (CORT group) or vehicle (CTRL group) in b hippocampus, c striatum, d thalamus, and e cortex of wild-type mice. Black dotted line indicates mean BPnd value of baseline scans, red dotted line indicates mean BPnd value of second scan in CORT group, and blue dotted line indicates mean BPnd value of second scan in CRTL group. One-way analysis of variance indicated a significant change in baseline BPnd values following CORT treatment in hippocampus (F2,52 = 12.58, P < 0.0001), striatum (F2,52 = 16.82, P < 0.0001), thalamus (F2,52 = 20.51, P < 0.0001), and cortex (F2,52 = 10.03, P = 0.0002), n = 8–27. P values indicate results of post hoc Tukey’s multiple comparison analysis. Data are presented as paired individual values (gray lines) at baseline and after CORT or CTRL treatment. BPnd non-displaceable binding potential, SUV standardized uptake value, ROI region of interest, CORT corticosterone treatment, CTRL control/vehicle treatment, ns nonsignificant, MR magnetic resonance, PET positron emission tomography

