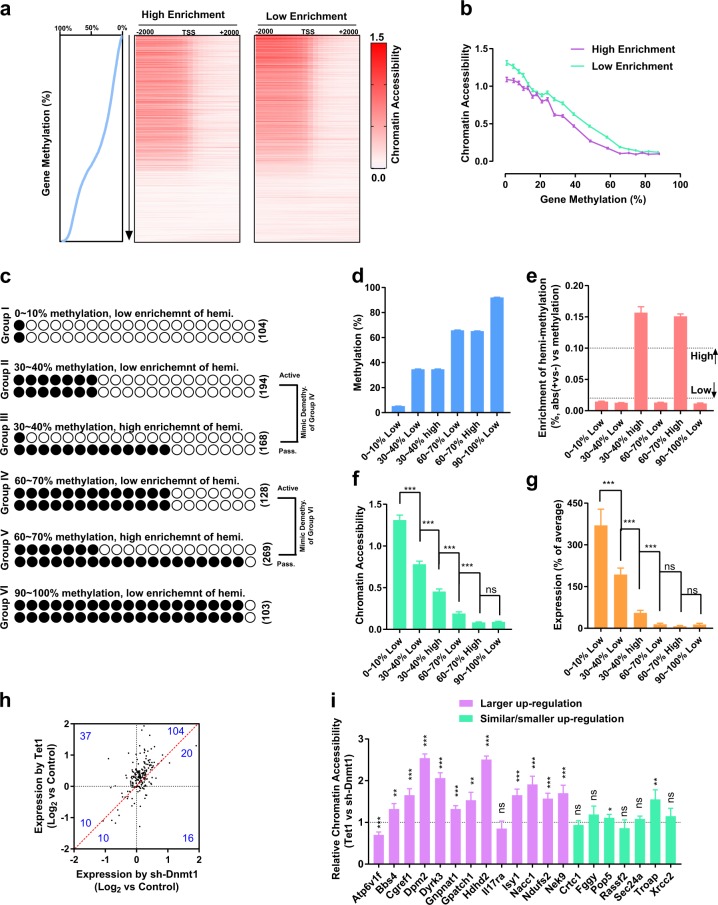
Fig. 4. Two types of DNA demethylation differentially influence gene expression.
The results obtained from the WGBS, ATAC-seq, and RNA-seq in assays of MEFs were analyzed together in a–g. The results obtained from WGBS (MEFs) and RRBS/RNA-seq (control, Tet1, and sh-Dnmt1 groups in MEFs) were analyzed in h, i. a First, genes were divided into 102 groups based their methylation levels (0%, 0–1%, …, 99–100%, and 100%). Then, the genes in each group were equally separated into two sub-groups, i.e., high enrichment and low enrichment, based on their AMDs. The genes from all high/low enrichment sub-groups were combined and sorted based on their methylation levels, and were presented along with their chromatin accessibility. The chromatin accessibilities generated from ATAC-seq were listed near TSS (−2.0 ~ + 2.0 kb). Gene methylation was plotted on the left. b First, the genes were divided into 20 groups (0–5%, …, and 95–100%). Then, the averages of gene methylation and chromatin accessibility were plotted. c–g Six sets of genes with particular methylation levels and enrichment of hemi-methylation were selected (c). The average methylation levels (d), enrichment of hemi-methylation (e), chromatin accessibilities (f), and gene expression (g) in MEFs were listed. The number of genes in each group was provided. h–i Of the 300 selected genes, the expression of 197 genes was detected in the current RNA-seq. The expression changes induced by Tet1 and sh-Dnmt1 were plotted in h. In total, 20 genes were randomly selected from these 197 genes, and the chromatin accessibilities of the genes in the Tet1 and sh-Dnmt1 groups were determined by ATAC-qPCR, compared, and plotted in i

