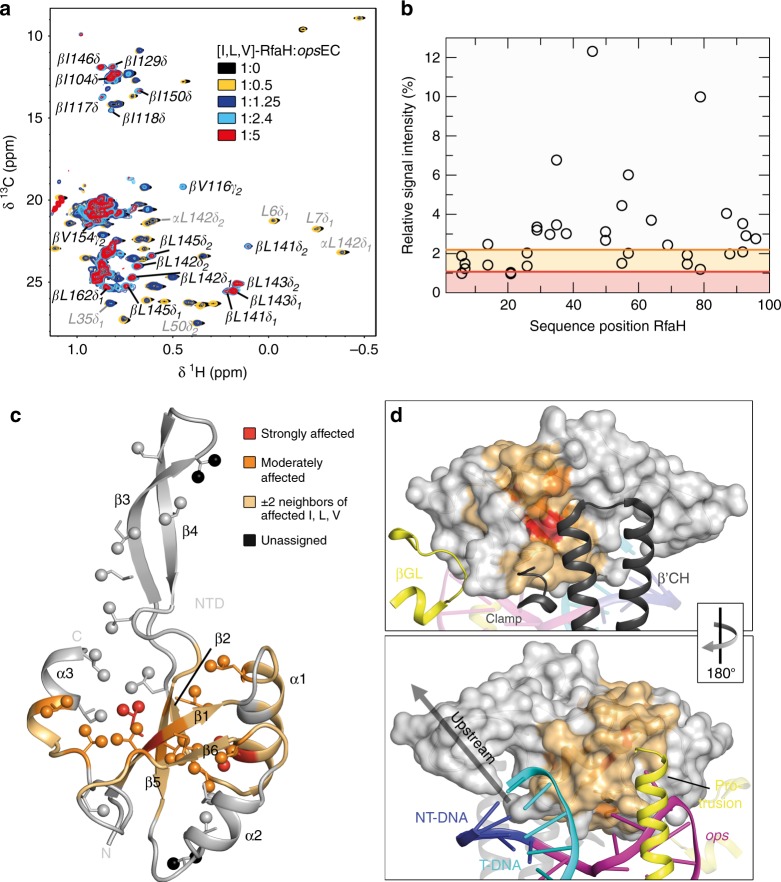
Fig. 4.
RfaH recruitment to the opsEC. a 2D [1H, 13C] methyl-TROSY spectra of [I,L,V]-RfaH in the absence or presence of opsEC assembled with 2H-RNAP (concentration of [I,L,V]-RfaH: 233 µM (1:0), 54 µM (1:0.5), 27 µM (1:1.25), 15 µM (1:2.4), 8 µM (1:5)). α and β indicate the all-α or all-β state of the RfaH-CTD. b Relative signal intensity of [I,L,V]-RfaH-NTD methyl groups with 0.5 equivalents of opsEC. Orange and red lines indicate thresholds for moderately (60% of average relative intensity) and strongly (30% of average relative intensity) affected methyl groups, respectively. Source data are provided as a Source Data file. c Mapping of affected methyl groups onto RfaH-NTD structure (ribbon representation; light gray; PDB ID: ‘5OND’). Ile, Leu, and Val residues are in stick representation with the carbon atom of the methyl groups as sphere. Termini and secondary structure elements are labeled. The representation was graphically extended by including the two flanking residues on each side of an affected residue (beige) as established39. d RfaH-NTD bound to the opsEC (PDB ID: ‘6C6S’). RfaH-NTD is in surface representation, color code as in c, DNA and selected elements of the RNAP are in ribbon representation and labeled. The arrow indicates how the structures are rotated with respect to each other

