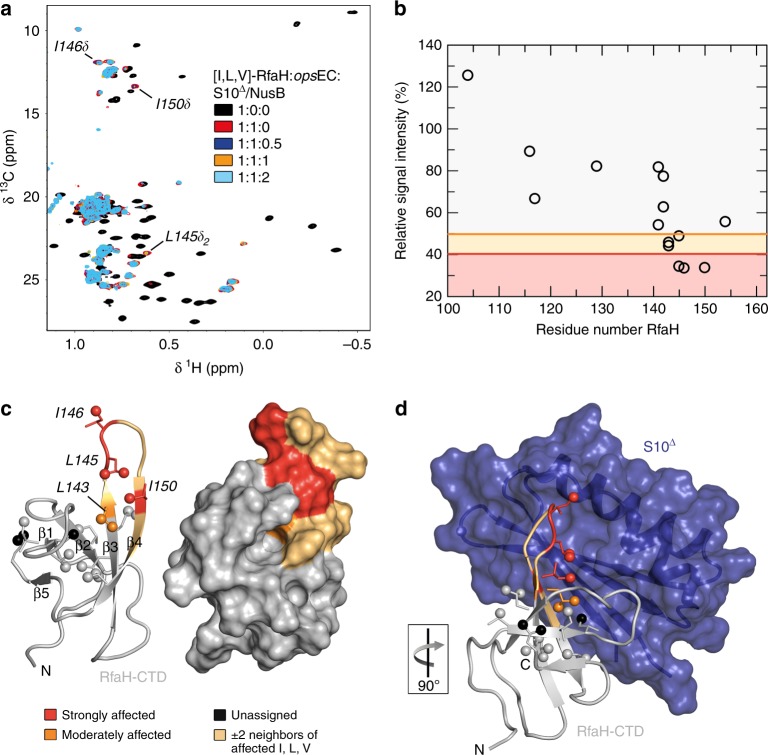
Fig. 5.
Structural basis of translation activation by RfaH. a 2D [1H, 13C] methyl-TROSY spectra of [I,L,V]-RfaH alone (200 µM), in the presence of equimolar concentration of opsEC (23 µM), and upon titration of RfaH:opsEC with 234 µM S10Δ:NusB; molar ratio [I,L,V]-RfaH:opsEC:S10Δ:NusB is indicated in color. Resonances with significant intensity changes are labeled. b Methyl-TROSY-derived relative intensity of [I,L,V]-RfaH methyl groups after addition of one equivalent of opsEC and two equivalents of S10Δ:NusB vs. sequence position in RfaH. Orange and red lines indicate thresholds for moderately affected (80% of the average relative intensity) and strongly affected (65% of the average relative intensity) methyl groups, respectively. Source data are provided as a Source Data file. c Mapping of affected methyl groups onto RfaH-CTD structure (PDB ID: ‘2LCL’). RfaH (gray) is shown in ribbon (left) and surface (right) representation, methyl groups are shown as spheres and are color-coded. d Model of the RfaH-CTD:S10Δ complex based on the NusG-CTD:S10Δ complex (PDB ID: ‘3D3B’). S10Δ in ribbon and surface representation (blue), representation of RfaH-CTD as in c. The orientation of RfaH-CTD relative to c is indicated

