Figure 6.
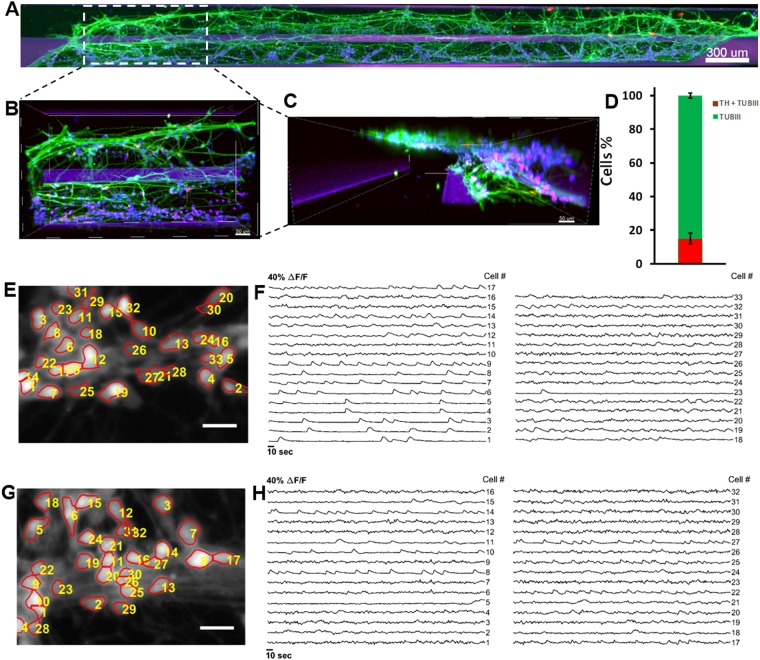
Immunostaining and automated cell segmentation of calcium time-series hNESC differentiated in chips of the OrganoPlate inside the Pelican. (A) Top view of an entire chip in the OrganoPlate showing differentiated wild type neurons (K7 cell line) immunostained for nuclei with Hoechst (blue), TUBβIII (green) and tyrosine hydroxylase (red); scale bar 300μm. (B) Enlarge top (B) and front (C) views of selected area; scale bar 50μm. (D) Differentiation efficiency of neurons positive for TUBβIII and tyrosine hydroxylase. (E) Mean fluorescence frame of a calcium time-series of WT population with segmented regions of interest corresponding to individual neurons and (F) their corresponding fluorescence traces. (G) Mean fluorescence frame of a calcium time-series of PINK1 mutants with segmented regions of interest corresponding to individual neurons and their corresponding fluorescence traces (H).

