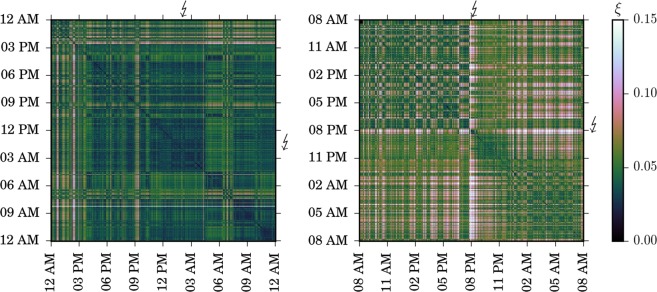
Figure 2.
Changes of the brain’s dynamical coupling structure prior to and after epileptic seizures. Enlarged views of exemplary similarity matrices ξ covering a period of 24 h from two subjects with epilepsy. Seizure onsets are marked by bolts on top and to the right of each matrix. Seizures lasted for about 2 min, on average. For a given coupling structure–represented as a point on the matrix diagonal–, the similarity to coupling structures at previous times can be found on the vertical line above this point, or on the horizontal line to the left of this point. Dark shading (small values of ξ) denotes similar coupling structures and light shading (high values of ξ) denotes dissimilar coupling structures.

