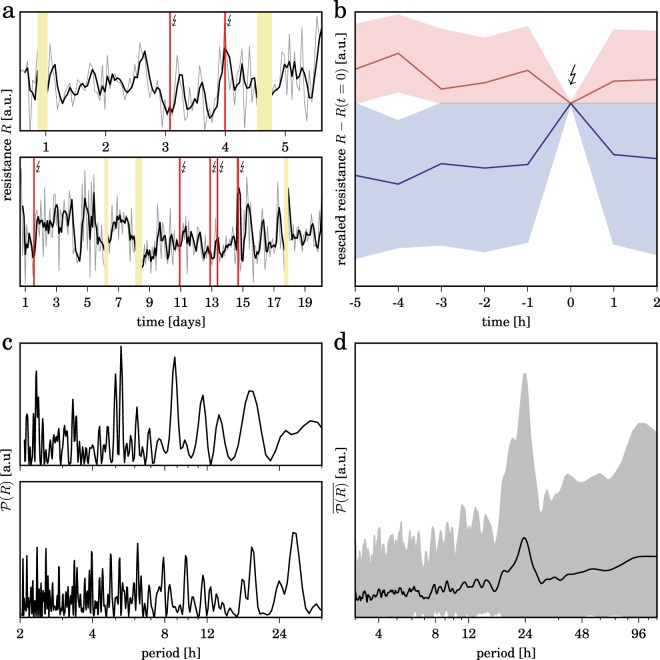
Figure 3.
Time-dependent fluctuations of resistance of brain dynamics. (a) Temporal evolutions of dynamical resistance R (grey lines) from two subjects with epilepsy. Data are derived from accessible dynamical regimes, and we find comparable time-dependent fluctuation with other number of accessible dynamical regimes (Supplementary Fig. S2). Smoothed temporal evolutions (moving average over 3 h) are shown as black lines; red vertical lines indicate times of seizure occurrence. Discontinuities in the temporal evolutions are due to recording gaps (colored khaki), and tics on x-axes denote midnight. (b) Temporal evolutions of dynamical resistance R when transiting into and out of epileptic seizures. Dynamical resistance values of the pre- and post-seizure period are rescaled to the value at seizure onset (t = 0). Decreasing values of resistance during the pre-seizure period (assumed duration: 4 h) are colored red and increasing values are colored blue. Means and standard deviations are shown by lines and shaded areas, respectively. (c) Periodograms66 of temporal evolutions of dynamical resistance depicted in (a) showing subject-specific ultradian (less than 24 h) and circadian (around 24 h) peaks in periodicity as well as infradian contributions (larger than 24 h)67. (d) Averaged periodogram of temporal evolutions of dynamical resistance from all subjects showing a pronounced circadian peak in periodicity. Mean values and standard deviations are shown as solid lines and shaded areas, respectively.

