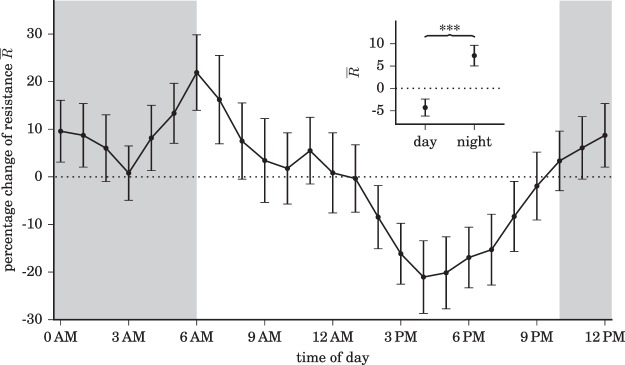
Figure 4.
Dynamical resistance of brains depending on daytime. Hourly averaged dynamical resistance (percent deviation from the 24 h average resistance; mean over data from all subjects with epilepsy; error bars represent standard error of the mean, s.e.m.). Data are derived from accessible dynamical regimes, and we find comparable time-dependent fluctuation with other number of accessible dynamical regimes (Supplementary Fig. S3). Data are smoothed (moving average over 3 h), and lines are for eye guidance only. Inset shows means and s.e.m. of values from recordings in the daytime and those at night-time (grey-shaded area). The black dotted lines indicate the mean resistance levels and asterisks indicate significant differences between the respective distributions (Kolmogorov-Smirnov test, p < 0.001).

