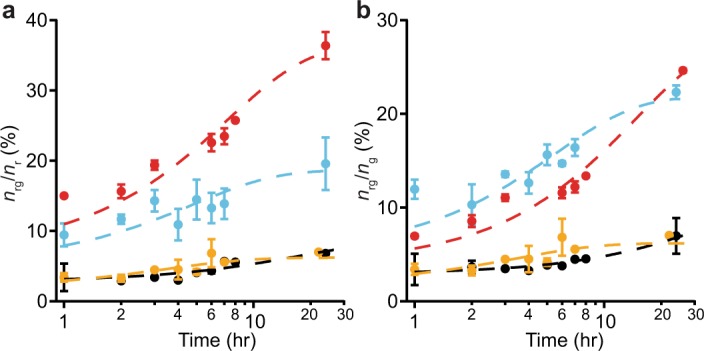
Figure 4.

Self-aggregation kinetics of α-synuclein constructs. (a) Time course of the average fraction of Cy5-labelled α-synuclein constructs incorporated into dual-colored aggregates. (b) Time course of the average fraction of Oregon green-labelled constructs incorporated into dual-colored aggregates. Dashed lines indicate fit to single-exponential growth. Black: αS-1, orange: αS-2, cyan: αS-4, red: αS-8. Error bars represent s.e.m.
