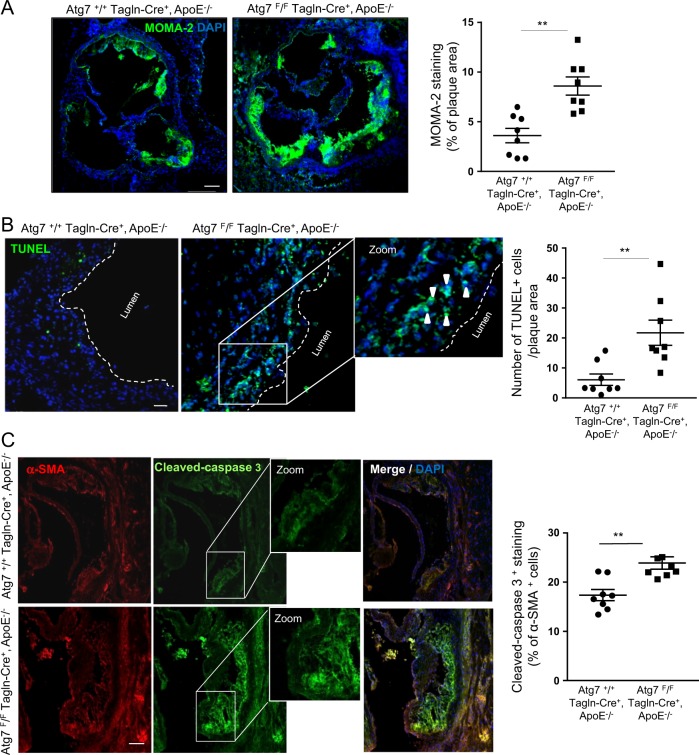
Fig. 2. Enhanced inflammation and apoptosis in atherosclerotic lesions of ApoE−/− mice deleted for Atg7 in vascular smooth muscle cells (VSMCs).
a Representative images of consecutive aortic sinus sections immunostained with MOMA 2 antibody to quantify the content of macrophages/monocytes in the plaque area of Atg7+/+ Tagln-Cre+, ApoE−/− and Atg7F/F Tagln-Cre+, ApoE−/− mice after 10 weeks of high-fat diet (HFD). DAPI (blue, nucleus). The graph represents the % of MOMA 2 staining and the data are the mean ± SEM, **P < 0.01; Student’s t-test, n = 8 mice/group. Scale bar, 200 µm. b Representative images of apoptotic cell detection by TUNEL staining in aortic sinus sections of Atg7+/+ Tagln-Cre+, ApoE−/− and Atg7 F/F Tagln-Cre+, ApoE−/− mice after 10 weeks of HFD. TUNEL (green), DAPI (blue, nucleus). The graph represents the number of TUNEL-positive cells measured in the plaque area and the data are the mean ± SEM. **P < 0.01; Student’s t-test, n = 8 mice/group. Scale bar, 50 µm. c Representative images of consecutive aortic sinus sections immunostained with cleaved-caspase 3 (green) and α-SMA (red) antibodies to detect apoptotic VSMCs of Atg7+/+ Tagln-Cre+, ApoE−/− and Atg7F/F Tagln-Cre+, ApoE−/− mice after 10 weeks of HFD. DAPI (blue, nucleus). The graph represents the % of cleaved-caspase 3-positive VSMCs measured in the plaque area and the data are the mean ± SEM. **P < 0.01; Student’s t-test, n = 8 mice/group. Scale bar, 50 µm

