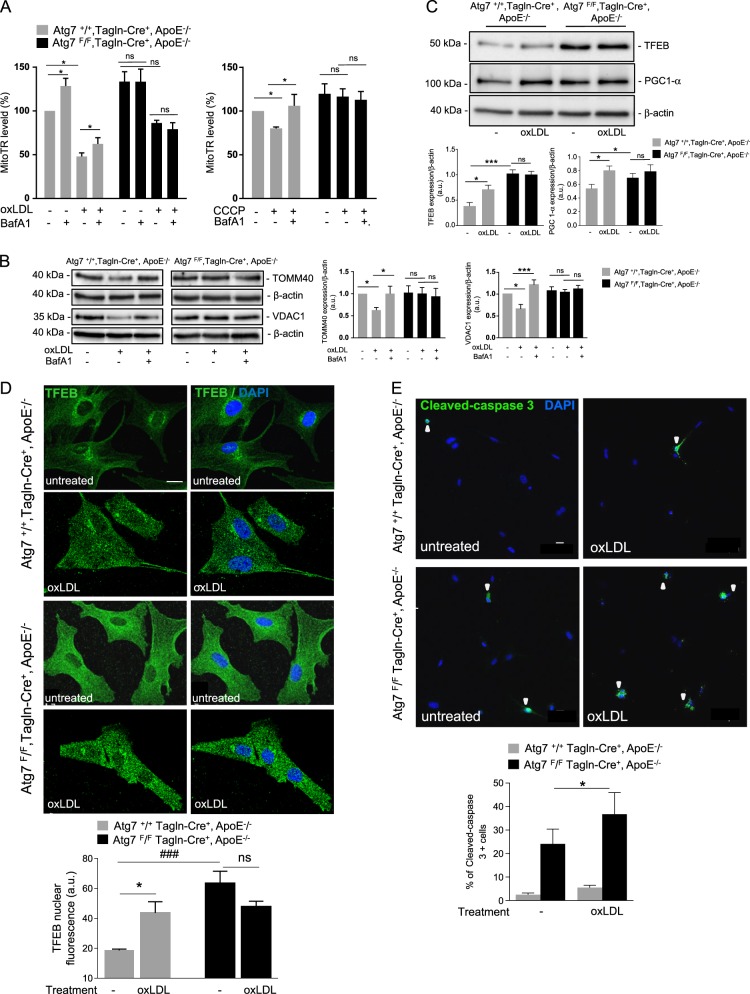
Fig. 6. Atg7 deficiency in vascular smooth muscle cells (VSMCs) alters mitochondrial quality control and enhances apoptosis.
a Flow cytometry analyses of mitophagy flux in aortic VSMCs isolated from Atg7+/+ Tagln-Cre+, ApoE−/− and Atg7F/F Tagln-Cre+, ApoE−/−mice after 10 weeks of high-fat diet (HFD). Cells were incubated either with or without oxidized LDL (200 μg ApoB/mL, left graph) or CCCP (20 µM, right graph) for 8 h and treated either with or without the lysosomal inhibitor Bafilomycin A1 (BafA1) (100 nM). VSMCs were then stained with MitoTR for flow cytometry analysis. The data are expressed as mean ± SEM of five independent experiments (left graph); *P < 0.05; Wilcoxon signed-rank test, ns nonsignificant; and as mean ± SEM of three independent experiments (right graph) *P < 0.05; Mann–Whitney non-parametric test. b Western blot analyses of the expression of TOMM 40 and VDAC1 proteins in aortic VSMCs isolated from Atg7+/+ Tagln-Cre+, ApoE−/− and Atg7F/F Tagln-Cre+, ApoE−/− mice after 10 weeks of HFD. Cells were incubated either with or without oxidized LDL (200 μg ApoB/mL) for 16 h and treated either with or without the lysosomal inhibitor Bafilomycin A1 (BafA1) (100 nM). β-Actin was used as the loading control. The graph represents the densitometric analysis of the expression level of TOMM 40 and VDAC1 proteins. The data are expressed as mean ± SEM of four independent experiments from different primary VSMC cultures. *P < 0.05; ***P < 0.01; one-way ANOVA, Bonferroni’s multiple comparison test. c Western blot analyses of the expression of TFEB and PGC-1-α proteins in aortic VSMCs isolated from Atg7+/+ Tagln-Cre+, ApoE−/− and Atg7F/F Tagln-Cre+, ApoE−/− mice after 10 weeks of HFD. Cells were incubated either with or without oxidized LDL (200 μg ApoB/mL) for 8 h. β-Actin was used as the loading control. The graph represents the densitometric analysis of the expression level of TFEB and PGC-1-α proteins. The data are expressed as mean ± SEM of four independent experiments from different primary VSMC cultures. *P < 0.05; ***P < 0.001; Student’s t-test. (d) Representative images of TFEB (green) and DAPI (blue, nucleus) immunostaining in aortic VSMCs isolated from Atg7+/+ Tagln-Cre+, ApoE−/− and Atg7F/F Tagln-Cre+, ApoE−/− mice after 10 weeks of HFD. Cells were incubated either with or without oxidized LDL (200 μg ApoB/mL) for 8 h. The graph represents the intensity of nuclear TFEB fluorescence and the data are the mean ± SEM of three independent experiments from different primary VSMC cultures. *P < 0.05; ###P < 0.001; one-way ANOVA, Kruskal–Wallis non-parametric test. e Representative images of cleaved-caspase 3 (green) and DAPI (blue, nucleus) immunostaining in aortic VSMCs isolated from Atg7+/+ Tagln-Cre+, ApoE−/− and Atg7F/F Tagln-Cre+, ApoE−/− mice after 10 weeks of HFD. Cells were incubated with or without oxidized LDL (200 μg ApoB/mL) for 16 h. Scale bar, 20 µm. The graph represents the % of cleaved-caspase 3-positive cells and the data are the mean ± SEM of three independent experiments from different primary VSMC cultures. *P < 0.05; two-way ANOVA, Bonferroni’s multiple comparison test. Scale bar, 20 µm

