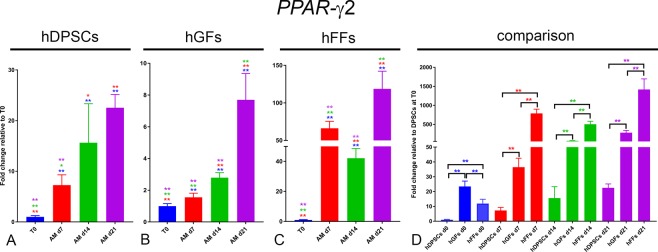
Figure 10.
Gene expression levels of PPAR-γ2 in cultured hDPSCs (A), hGFs (B) and hFFs (C) for 1, 7, 14 and 21 days in presence of AM, relative to the respective expression levels at T0. (D) Expression levels of PPAR-γ2 normalized for PPAR-γ2 expression in hDPSCs at T0. Asterisks: Mann Whitney – U/Wilcox Rank Sum Test, *p < 0.05; **p < 0.01. Colour of asterisks onto each column indicates the column used for the comparison. Abbreviations: hDPSCs, human dental pulp stem cells; hFF, human foreskin fibroblasts; hGF, human gingival fibroblasts; AM, adipogenic medium.

