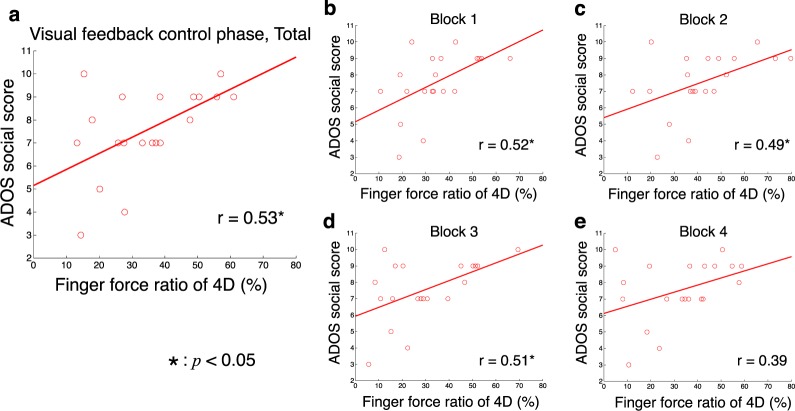
Figure 3.
Relationships between force ratio of 4D and ADOS score. The horizontal axis denotes the force ratio of the 4D (ring finger) during visual feedback-control phase across all trials (a) and from block1 (b) to block4 (e). The vertical axis denotes ADOS social score. Circles and lines indicate data of individual participants and linear regressed lines, respectively. Coefficients of correlation (r) are presented. The asterisk denotes significant correlation (p < 0.05).

