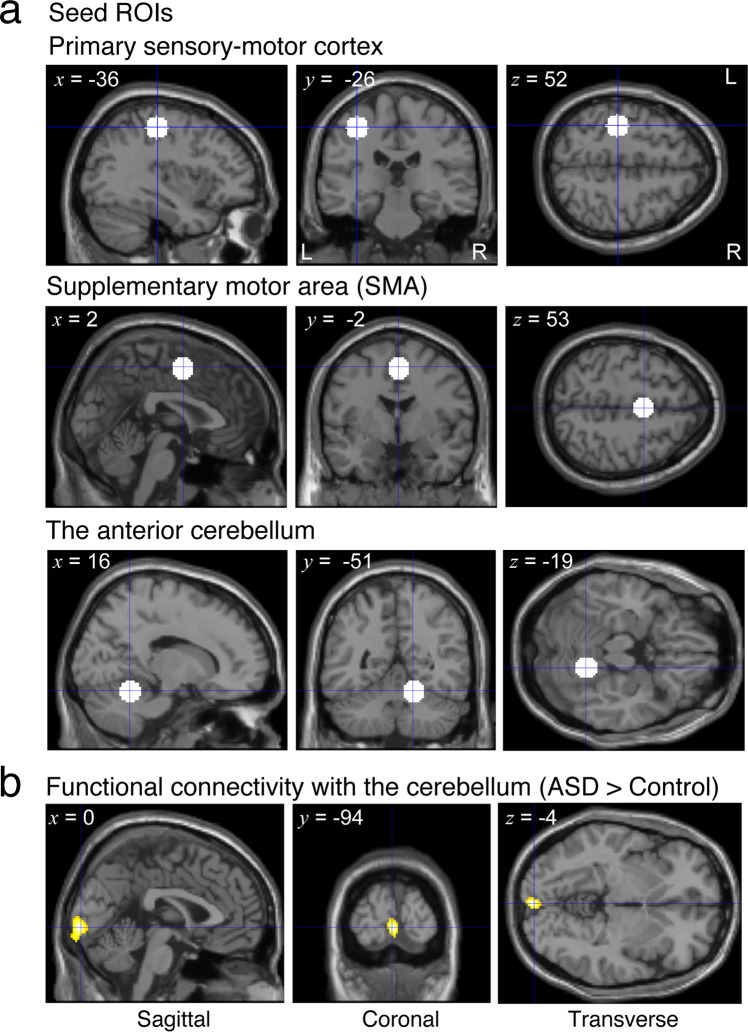
Figure 5.
Seed regions and functional connectivity map. (a) White circles indicate seed regions (spheres with 7.5-mm radius) in the hand areas of the three brain regions related to control of hand movements. x, y and z represent the center of the spheres in the MNI coordinates. (b) Yellow regions indicate a cluster region in the primary visual cortex where functional connectivity with the cerebellum is significantly higher in participants with ASD than TD controls (initial cluster-forming threshold: P < 0.001, peak height threshold: P < 0.05 FWE corrected). x, y and z represent the peak of correlation value.

