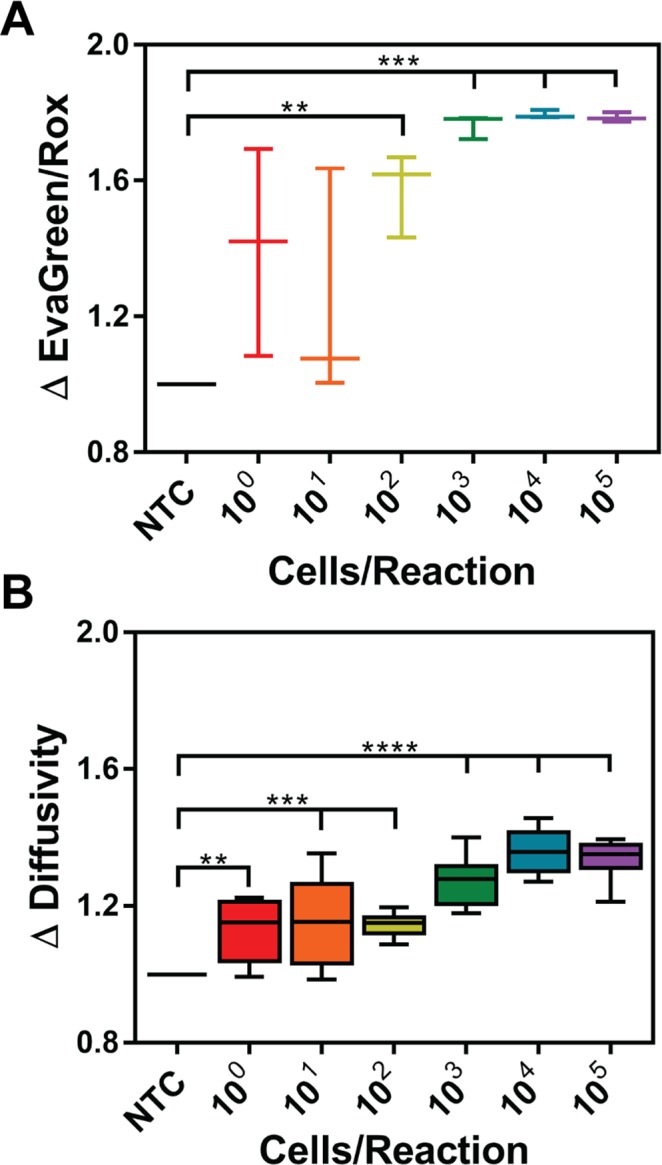
Figure 5.

Measuring LAMP amplification from V. cholerae whole cells. Cells were spiked into LAMP reactions at concentrations ranging from 100–105 cells/reaction. The change in (A) EvaGreen/Rox is significant at 102 (**p < 0.01), 103, 104, and 105 (***p < 0.001) cells/reaction. (B) The change in diffusivity measurements show an increasing trend as a function of starting cell concentration with significance at 100 (**p < 0.01), 101, 102 (***p < 0.001), 103, 104, and 105 (****p < 0.0001) cells/reaction. Statistical analysis was a one-way ANOVA with Dunnett’s post-hoc relative to NTC (n = 3).
