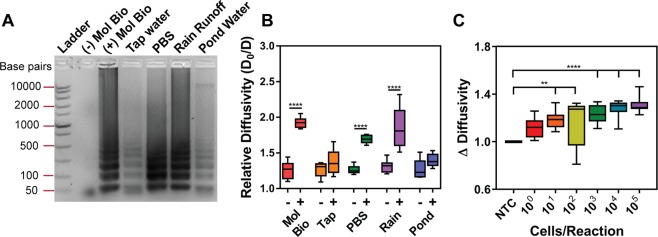
Figure 6.
LAMP amplification from whole V. cholerae cells in environmental water sources. Different water sources were used in the LAMP reactions for (A) and (B). Molecular biology water (Mol Bio) was used as a control ((−) no V. cholerae cells, (+) V. cholerae cells) for each water source in (A) and (B). (A) Gel electrophoresis shows less DNA amplification in pond and tap water groups compared to other water sources. (B) PD measurement of relative diffusivity shows a statistically significant difference between negative and positive samples for molecular biology water, PBS, and rain runoff groups (****p-values < 0.0001). (C) V. cholerae cells were spiked into pond water at concentrations ranging from 100–105 cells/reaction. The change in diffusivity measurements show an increasing trend as a function of starting cell concentration with significance at 101, 102 (**p < 0.01), 103, 104, and 105 (****p < 0.0001) cells/reaction. Statistical analysis was a one-way ANOVA with Dunnett’s post-hoc relative to NTC (n = 3).

