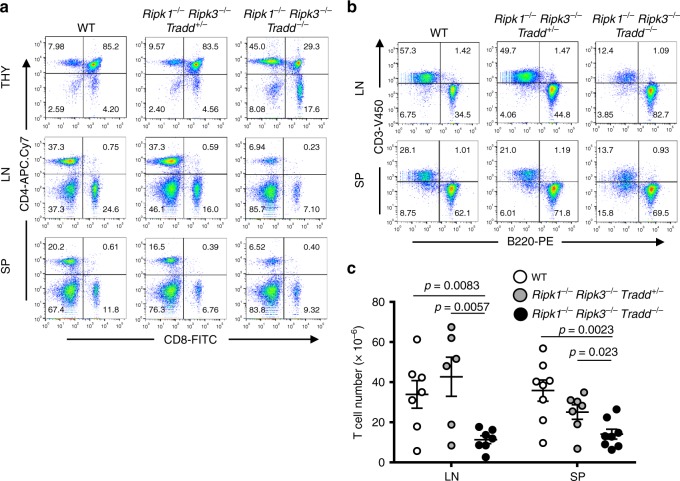
Fig. 3.
Ripk1−/−Ripk3−/−Tradd−/− mice display impaired T cell development and T lymphopenia in young adulthood. a, b Representative two-color flow cytometric plots showing a CD4+ and CD8+ T cells in the lymph nodes, spleen, and thymus and b T cells (CD3+) and B cells (B220+) in the lymph nodes and spleen (n = 8 independent experiments). c CD3+ T cell numbers in the lymphoid organs of 7–8 week old mice of indicated genotypes (n = 7 independent experiments). All graphs presented as mean ± SEM

