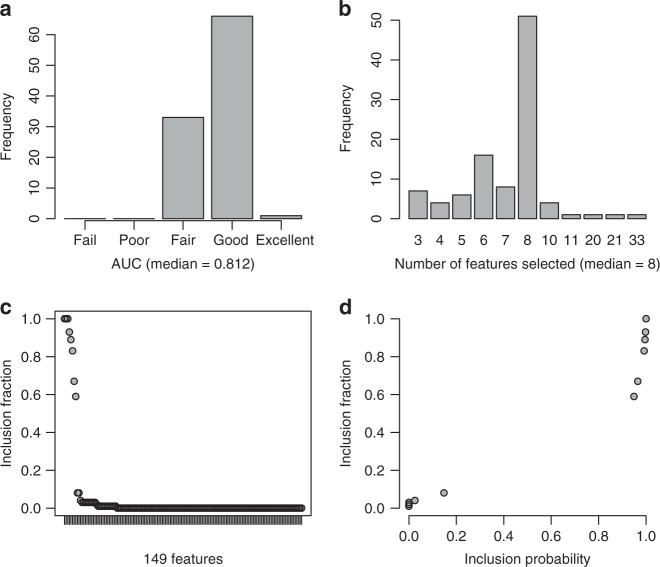
Fig. 1. A summary of the 100 models selected using lasso regression with repeated cross-validation.
a A bar chart summarizing the AUCs for each model. AUC: Fail 0.5–0.6; Poor 0.6–0.7; Fair 0.7–0.8; Good 0.8–0.9; and, 0.9–1.00 Excellent. b A bar chart summarizing the number of features selected in each model. c An inclusion fraction plot summarizing the proportion of times each feature was selected in a model. One hundred and seventeen features out of 149 (147 peptides, sex, and age) were not selected in the 100 models. d A plot of inclusion frequencies and probabilities for the 32 selected features

