

Abstract
Background
Iodine deficiency disorders (IDD) affect close to 1.9 billion people worldwide, and are a major public health concern in many countries. Among children, iodine deficiency is the main cause of potentially preventable deficits of central nervous system development and impairment of cognitive function, as well as goitre and hypothyroidism in people of all ages. Salt iodisation is the preferred strategy for IDD prevention and control, however, in some instances where salt is not the major condiment, alternate vehicles for iodine fortification have been considered.
Objectives
To assess the effects of fortifying foods, beverages, condiments, or seasonings other than salt with iodine alone or in conjunction with other micronutrients, on iodine status and health‐related outcomes in all populations.
Search methods
Studies were identified through systematic searches of the following databases from their start date to January 2018: Cochrane Public Health Group Specialised Register; CENTRAL; MEDLINE; MEDLINE in Process; Embase; Web of Science; CINAHL; POPLINE; AGRICOLA; BIOSIS; Food Science and Technology Abstracts; OpenGrey; Bibliomap and TRoPHI; AGRIS; IBECS; Scielo; Global Index Medicus‐AFRO and EMRO; LILACS; PAHO; WHOLIS; WPRO; IMSEAR; IndMED; and Native Health Research Database. We also searched reference list of relevant articles, conference proceedings, and databases of ongoing trials, and contacted experts and relevant organisations to identify any unpublished work. We applied no language or date restrictions.
Selection criteria
Studies were eligible if they were randomised or quasi‐randomised controlled trials (RCT) with randomisation at either the individual or cluster level (including cross‐over trials), non‐randomised RCTs, or prospective observational studies with a control group, such as cohort studies, controlled before‐and‐after studies, and interrupted time series. We included studies that examined the effects of fortification of food, beverage, condiment, or seasoning with iodine alone, or in combination with other micronutrients versus the same unfortified food, or no intervention. We considered the following measures: death (all‐cause), goitre, physical development, mental development, cognitive function and motor skill development, cretinism, hypothyroidism, adverse effects (any reported by trialists), urinary iodine concentration, thyroid‐stimulating hormone (TSH) concentration, and serum thyroglobulin concentration. We included all populations, including pregnant women, from any country.
Data collection and analysis
Two review authors independently assessed study eligibility, extracted data, and assessed risk of bias of included studies.
We used random‐effects meta‐analyses to combine data and generate an overall estimate of treatment effect, when more than one study examined the same outcome measure. The overall effect estimate was calculated as the mean difference (MD) or standardised mean difference (SMD) between the intervention group and the comparison group for continuous outcomes, and as odds ratio (OR) for dichotomous outcomes. We assessed the level of heterogeneity through the I² statistic. We conducted post‐hoc subgroup analyses to explore possible sources of heterogeneity, and sensitivity analyses to check the robustness of the findings from the primary analyses. We assessed the quality of the evidence for each outcome using the GRADE framework.
Where it was not possible to pool the results in a meta‐analysis, we provided a narrative summary of the outcomes.
Main results
Eleven studies met the criteria, providing 14 comparisons, and capturing data on 4317 participants. Seven studies were RCTs, three were cluster non‐RCTs, and one was a randomised cross‐over design. Seven studies were carried out among school children (N = 3636), three among women of reproductive age (N = 648), and one among infants (N = 33). The studies used diverse types of food as vehicle for iodine delivery: biscuits, milk, fish sauce, drinking water, yoghourt, fruit beverage, seasoning powder, and infant formula milk. Daily amounts of iodine provided ranged from 35 µg/day to 220 µg/day; trial duration ranged from 11 days to 48 weeks. Five studies examined the effect of iodine fortification alone, two against the same unfortified food, and three against no intervention. Six studies evaluated the effect of cofortification of iodine with other micronutrients versus the same food without iodine but with different levels of other micronutrients. We assessed one study to be at low risk of bias for all bias domains, three at low risk of bias for all domains apart from selective reporting, and seven at an overall rating of high risk of bias.
No study assessed the primary outcomes of death, mental development, cognitive function, cretinism, or hypothyroidism, or secondary outcomes of TSH or serum thyroglobulin concentration. Two studies reported the effects on goitre, one on physical development measures, and one on adverse effects. All studies assessed urinary iodine concentration.
The effects of iodine fortification compared to control on goitre prevalence (OR 1.60, 95% CI 0.60 to 4.31; 1 non‐RCT, 83 participants; very low‐quality evidence), and five physical development measures were uncertain (1 non‐RCT, 83 participants; very low‐quality evidence): weight (MD 0.23 kg, 95% CI ‐6.30 to 6.77); height (MD ‐0.66 cm, 95% CI ‐4.64 to 3.33); weight‐for‐age (MD 0.05, 95% CI ‐0.59 to 0.69); height‐for‐age (MD ‐0.30, 95% CI ‐0.75 to 0.15); and weight‐for‐height (MD ‐0.21, 95% CI ‐0.51 to 0.10). One study reported that there were no adverse events observed during the cross‐over trial (low‐quality evidence).
Pooled results from RCTs showed that urinary iodine concentration significantly increased following iodine fortification (SMD 0.59, 95% CI 0.37 to 0.81; 6 RCTs, 2032 participants; moderate‐quality evidence). This is equivalent to an increase of 38.32 µg/L (95% CI 24.03 to 52.61 µg/L). This effect was not observed in the meta‐analysis of non‐RCTs (SMD 0.25, 95% CI ‐0.16 to 0.66; 3 non‐RCTs, 262 participants; very low‐quality evidence). Sensitivity analyses did not change the effect observed in the primary analyses.
Authors' conclusions
The evidence on the effect of iodine fortification of foods, beverages, condiments, or seasonings other than salt on reducing goitre, improving physical development measures, and any adverse effects is uncertain. However, our findings suggest that the intervention likely increases urinary iodine concentration. Additional, adequately powered, high‐quality studies on the effects of iodine fortification of foods on these, and other important outcomes, as well as its efficacy and safety, are required.
Keywords: Adolescent; Adult; Child; Child, Preschool; Female; Humans; Infant; Young Adult; Condiments; Food, Fortified; Goiter; Goiter/epidemiology; Goiter/prevention & control; Iodine; Iodine/administration & dosage; Iodine/deficiency; Iodine/urine; Micronutrients; Micronutrients/administration & dosage; Prevalence; Randomized Controlled Trials as Topic; Trace Elements; Trace Elements/administration & dosage; Trace Elements/deficiency; Trace Elements/urine
Plain language summary
Adding iodine to foods, other than salt, to prevent diseases caused by inadequate iodine intake
Background and review question
Many people around the world do not consume enough iodine. This is a problem because iodine is important for normal childhood growth and brain development, and for ensuring a healthy adult population. Inadequate intake of iodine can lead to health problems, such as intellectual disability and goitre (enlargement of the thyroid gland). Currently, the main strategy to increase the amount of iodine consumed in populations recommended by the World Health Organization is adding iodine to salt. However, in some areas where salt is not the major condiment, adding iodine to other foods has also been explored. The aim of our study was to examine the effect of adding iodine to foods, beverages, condiments, or seasonings, other than salt, on iodine nutrition status and health‐related outcomes in all populations.
Study characteristics
We searched for articles from different sources including published research papers, unpublished reports, and through direct communication with experts and organisations working to address iodine and micronutrient deficiency. We last searched the databases in January 2018.
Eleven studies, which captured data on 4317 participants (3636 children, 648 women of reproductive age, and 33 infants), met our inclusion criteria. The type of foods used as vehicle to deliver iodine differed between the studies, and included biscuits, milk, fish sauce, drinking water, yoghourt, fruit beverage, seasoning powder, and infant formula milk. The amount of iodine provided to participants ranged from 35 µg/day to 220 µg/day, and study duration ranged from 11 days to 48 weeks. Of the 11 studies included, five examined the effect of adding iodine alone to foods compared to either no intervention or the same foods without iodine; while six evaluated the effect of adding iodine plus other micronutrients to foods compared to the same foods without iodine, but with different levels of other micronutrients.
Key results
No study evaluated the effect of adding iodine to foods on death, mental development, cognitive function, cretinism (a condition characterized by impaired control of physical movement and intellectual disability), hypothyroidism (underactive thyroid), thyroid‐stimulating hormone concentration, or serum thyroglobulin concentration (these are biological markers that indicate the presence of iodine deficiency when concentration in the blood is high).
Two studies reported on the effect of the intervention on goitre, one study assessed five physical development measures (weight, height, weight‐for‐age, height‐for‐age, and weight‐for‐height scores), and one examined adverse effects. All studies assessed urinary iodine concentration (the concentration of iodine secreted in the urine, which indicates the presence of iodine deficiency when concentration is low in a population group, rather than in an individual). We combined the data that met our requirements in these studies in a meta‐analysis.
We are uncertain of the effects of iodine fortification on the proportion of participants with goitre, or on any of the five physical development measures. One study reported narratively that no adverse effects were observed during the trial. We found a significant increase of 38.32 µg/L in urinary iodine concentration after adding iodine to foods, compared to the groups that did not have iodine added, from studies of higher quality.
Quality of the evidence
Using GRADE, we rated the quality of the evidence as very low for goitre and physical development measures, due to study limitations (risk of bias) and imprecise results, and low for adverse events due to indirectness and imprecise results. We rated the quality of the evidence for urinary iodine concentration, from studies in which participants were allocated to treatment groups at random (gold standard design for clinical research), as moderate. On the other hand, quality of the evidence for urinary iodine concentration from studies without this random element was rated as very low, due to study limitations and imprecise results.
Conclusion
Overall, there is no clear evidence on the effect of the intervention on reducing the proportion of people with goitre, improving physical growth, or adverse events. However, our results show that adding iodine to foods likely increases urinary iodine concentration. Additional studies to better quantify the effect of the intervention on these outcomes, as well as other outcomes, are needed.
Summary of findings
Summary of findings for the main comparison. Iodine fortification of foods and condiments, other than salt, for preventing iodine deficiency disorders.
| Iodine fortification of foods and condiments, other than salt, for preventing iodine deficiency disorders | ||||||
| Patient or population: all populations, including pregnant women, from any country Setting: Bangladesh, Iran, Kuwait, Philippines, Russia, South Africa, Switzerland, Thailand, Vietnam Intervention: iodine fortification of food, beverage, condiment or seasoning Comparison: same unfortified food or no intervention | ||||||
| Outcomes | Anticipated absolute effects* (95% CI) | Relative effect (95% CI) | № of participants (studies) | Certainty of the evidence (GRADE) | Comments | |
| Risk with control | Risk with Iodine fortification of food | |||||
| 1. Death (all‐cause) | See comment | See comment | Not estimable | ‐ | See comment | No studies measured death. |
|
2. Goitre prevalence (RCT) assessed with palpation and visual inspection follow‐up: 48 weeks |
"The prevalence of goiter, which was 20% and 22.1% at the baseline assessment in the intervention and control groups, respectively (19% palpable; 2% visible), did not decrease after 12 months of iodine fortification." | ‐ | Number of participants at follow‐up was not reported (1 RCT) |
⊕⊝⊝⊝ VERY LOW 1 2 | We are uncertain about the effect of iodine fortification on goitre prevalence. | |
|
3. Goitre prevalence (non‐RCT) assessed with thyroid palpation follow‐up: 48 weeks |
308 per 1,000 | 416 per 1,000 (211 to 657) | OR 1.60 (0.60 to 4.31) | 83 (1 non‐RCT with 2 comparisons) 3 | ⊕⊝⊝⊝ VERY LOW 4 5 | We are uncertain about the effect of iodine fortification on goitre prevalence. |
| 4. Physical development measures (non‐RCT) | ||||||
| a. Weight assessed with beam balance follow‐up: 48 weeks |
The mean weight in the intervention group was 0.23 kg higher (6.3 lower to 6.77 higher) | ‐ | 83 (1 non‐RCT with 2 comparisons) 3 | ⊕⊝⊝⊝ VERY LOW 4 5 | We are uncertain about the effect of iodine fortification on physical development measures: weight, height, weight‐for‐age, height‐for‐age, weight‐for‐height. | |
| b. Height assessment tool not reported follow‐up: 48 weeks |
The mean height in the intervention group was 0.66 cm lower (4.64 lower to 3.33 higher) | |||||
| c. Weight‐for‐age computed from weight and age values follow‐up: 48 weeks |
The mean weight‐for‐age score in the intervention group was 0.05 points higher (0.59 lower to 0.69 higher) | |||||
| d. Height‐for‐age computed from height and age values follow‐up: 48 weeks |
The mean height‐for‐age score in the intervention group was 0.3 points lower (0.75 lower to 0.15 higher) | |||||
| e. Weight‐for‐height computed from weight and height values follow‐up: 48 weeks |
The mean weight‐for‐height score in the intervention group was 0.21 points lower (0.51 lower to 0.1 higher) | |||||
| 5. Mental development | See comment | See comment | Not estimable | ‐ | See comment | No studies measured mental development. |
| 6. Cognitive function and motor skill development | See comment | See comment | Not estimable | ‐ | See comment | No studies measured cognitive function and motor skill development. |
| 7. Cretinism | See comment | See comment | Not estimable | ‐ | See comment | No studies measured cretinism. |
| 8. Hypothyroidism | See comment | See comment | Not estimable | ‐ | See comment | No studies measured hypothyroidism. |
|
9. Adverse effects (RCT) assessed with: not reported follow‐up: 11 days |
"No adverse effects were reported during the trial." | ‐ | 33 (1 RCT with 2 comparisons) 3 6 | ⊕⊕⊝⊝ LOW 7 8 9 | We have limited confidence about the adverse effects of iodine fortification of food. | |
|
10. Urinary iodine concentration (RCT) assessed with spot urine samples follow‐up: range 4 weeks to 48 weeks |
SMD 0.59 higher (0.37 higher to 0.81 higher) The mean urinary iodine concentration in the intervention group was 38.32 µg/L higher (24.03 higher to 52.61 higher) |
‐ | 2032 (6 RCTs) | ⊕⊕⊕⊝ MODERATE10 | Based on results from RCTs, we are moderately confident that iodine fortification of food increases urinary iodine concentration. An SMD of 0.59 can be considered a medium effect size. | |
|
11. Urinary iodine concentration (non‐RCT) assessed with spot urine samples follow‐up: range 24 weeks to 48 weeks |
SMD 0.25 higher (0.16 lower to 0.66 higher) The mean urinary iodine concentration in the intervention group was 16.23 µg/L higher (10.39 lower to 42.87 higher) |
‐ | 262 (3 non‐RCTs with 5 comparisons) |
⊕⊝⊝⊝ VERY LOW 11 12 | Based on results from non‐RCTs, we are uncertain about the effect of iodine fortification on urinary iodine concentration. | |
| 12. Thyroid‐stimulating hormone concentration | See comment | See comment | Not estimable | ‐ | See comment | No studies measured thyroid‐stimulating hormone concentration. |
| 13. Serum thyroglobulin concentration | See comment | See comment | Not estimable | ‐ | See comment | No studies measured serum thyroglobulin concentration. |
| *The risk in the intervention group (and its 95% confidence interval) is based on the assumed risk in the comparison group and the relative effect of the intervention (and its 95% CI). CI: Confidence interval; OR: Odds ratio; RCT: Randomised controlled trial | ||||||
| GRADE Working Group grades of evidence High certainty: We are very confident that the true effect lies close to that of the estimate of the effect Moderate certainty: We are moderately confident in the effect estimate: The true effect is likely to be close to the estimate of the effect, but there is a possibility that it is substantially different Low certainty: Our confidence in the effect estimate is limited: The true effect may be substantially different from the estimate of the effect Very low certainty: We have very little confidence in the effect estimate: The true effect is likely to be substantially different from the estimate of effect | ||||||
1 Downgraded 2 for risk of bias: evidence for the effect of iodine fortification comes from a single RCT, assessed to be at high risk of bias for random sequence generation and allocation concealment, and unclear risk of bias for incomplete outcome data and selective reporting.
2 Downgraded 1 for imprecision: not estimable, but review authors downgraded by one level given that the baseline sample size was low, and the optimal information size criterion was not met.
3 All information is from one study with two comparisons.
4 Downgraded 2 for risk of bias: evidence for the effect of iodine fortification comes from a single non‐RCT with two comparisons.
5 Downgraded 1 for imprecision: sample size was small and confidence interval was wide around the estimate of effect. The confidence interval crossed the line of null effect.
6 This is a cross‐over randomised trial.
7 Not downgraded for inconsistency: not estimable since only one study reported this outcome, but review authors believe that inconsistency is unlikely, given there was no difference in outcome occurrence between the groups.
8 Downgraded 1 for indirectness: nutrient balance study; the study was not an intervention study to determine the effectiveness of iodine fortification of food in improving iodine nutrition status.
9 Downgraded 1 for imprecision: not estimable since only one study reported this outcome, but review authors rated this down by one level given that both event rate and sample size are very low, and the optimal information size criterion is not met.
10 Downgraded 1 for risk of bias: three large studies with a combined weight of about 60% at low or unclear risk of bias; four of six studies were at high risk of bias based on the presence of high or unclear risk of bias in allocation concealment, incomplete outcome data, and other sources of bias.
11 Downgraded 2 for risk of bias: estimates from three non‐RCTs at high risk of bias
12 Downgraded 1 for imprecision: confidence interval was wide around the estimate of effect, and crossed the line of null effect
Background
Description of the condition
Iodine is a trace element that is essential for life. It can be found in top soil, water, kelp (seaweed), seafood, dairy products, certain crops, and iodised salt. Physiologically, iodine is used for the production of thyroid hormones, thyroxine (T4), and triiodothyronine (T3) (Angermayr 2004). Synthesis and release of T3 and T4 are regulated by the pituitary thyroid‐stimulating hormone (TSH or thyrotropin). When circulating T3 and T4 concentrations are low, TSH production is increased, and as the opposite is also true, this creates a negative feedback loop between the pituitary and thyroid (Sukuzi 2011). Thyroid homeostasis results from the feedback loop, and this plays an important role in biological functions, including metabolism, body temperature control, and normal growth and development (Hetzel 1983).
When iodine intake is inadequate, the thyroid gland may no longer be able to synthesise sufficient amounts of thyroid hormone. Low levels of thyroid hormones in the blood – referred to as hypothyroidism – are responsible for damage to the developing brain, and for a whole spectrum of iodine deficiency disorders (IDD) (WHO 2007a). This term, IDD, refers to several consequences that iodine deficiency imposes on individuals and in populations that can be prevented by ensuring that the population has an adequate intake of iodine. Adequate iodine intake is required for optimal childhood growth and development, and to ensure a healthy adult population. International organisations recommend a daily iodine intake of 90 µg for preschool children (0 to 59 months), 120 µg for children aged six to 12 years, 150 µg for adolescents (above 12 years) and adults, and 250 µg for pregnant and lactating women (WHO 2007a;WHO 2007c).
Both insufficient and excess iodine can have negative effects on thyroid function. Individuals living in areas affected by severe iodine deficiency may have an intelligence quotient (IQ) up to 13.5 points below that of people from comparable communities where there is no iodine deficiency (Bleichrodt 1994). Lack of adequate iodine intake can result in impaired cognitive development and function, hypothyroidism, congenital anomalies, cretinism or endemic goitre (Zimmerman 2008). Although complications from excess intake of iodine are rare, iodine‐induced hyperthyroidism can occur (Roti 2001), and there have been a limited number of reports of toxicity (Pennington 1990). There are three main laboratory indicators of iodine deficiency: increased TSH concentration in neonatal blood and cord blood, increased concentration of thyroglobulin, and decreased concentration of iodine in the urine. Development of goitre, i.e. an enlargement of the thyroid gland (due to stimulation of growth by TSH) is common in areas where there is lack of iodine in soil and water (endemic goitre), and is not always accompanied by an abnormality in thyroid hormones (euthyroid goitre).
It is estimated that 1.88 billion people worldwide are still at risk of insufficient iodine intake (Andersson 2012), and approximately a third of the world’s population lives in areas of iodine deficiency (Angermayr 2004). Iodine deficiency is particularly common in countries in the Eastern Mediterranean region, Asia, Africa, and large parts of Eastern Europe (Andersson 2007; Ramakrishnan 2002). Inland areas, especially mountainous areas like the Alps, Himalayas, and the Andes are particularly prone to iodine deficiency (Zimmerman 2009). In some areas of China, iodine deficiency affected more than 50% of the population (Chen 1984; Fong 1981; Li 1997; Lin 1995). However, the problem is not confined to developing countries – Australia, New Zealand, and the United Kingdom are confronted with a re‐emergence of mild iodine deficiency (Li 2006; Vanderpump 2011; Zimmerman 2010).
Description of the intervention
Food fortification – the addition of nutrients to food – is one of several proven approaches available to address the problem of micronutrient malnutrition in public health, and is a cost‐effective and sustainable strategy (Haas 2006). Fortification of salt with iodine, termed 'salt iodisation' is one of the main means of increasing a population's iodine intake and reducing the risk of IDD (WHO 2007b). Universal iodisation of salt is the preferred strategy for the control of IDD in most countries. Salt is the vehicle of choice for fortification for the following reasons: 1) it is consumed by nearly everyone at roughly equal amounts throughout the year; 2) salt production is often limited to a few centres, which facilitates quality control; 3) addition of iodate or iodide does not affect the taste or smell of the salt, and; 4) iodisation is cheap (less than 0.01 USD per person per day (Zimmerman 2008)). However, there are several issues that influence the ability of countries to attain the recommended level of iodine fortification, which include: non‐iodised salt competition; non‐standardised iodisation; and preferences for use of large crystal salt (Lv 2009; The Micronutrient Initiative 2011).
Currently, the recommended average levels of iodine added to salt fall between 40 mg/kg and 20 mg/kg, based on an estimated average salt consumption in adult populations of 5 to 10 grams per day (g/d) (WHO 1996; WHO 2014a). These iodine levels are considered safe up to salt intakes of around 25 g/d when the dietary iodine supply is low, as it is in most typical diets in the world. The number of countries where at least 90% of households had access to adequately iodised salt dropped in the period from 2006 to 2010 (UNICEF 2012). There have been problems with implementing salt iodisation in countries with numerous scattered salt deposits, complex distribution systems, illegal production, and distribution of less expensive, non‐iodised or inadequately‐iodised salt (Nazeri 2010). Moreover, as reducing population salt intake is now a public health priority (Beaglehole 2012), and governments begin to adopt strategies that aim to reduce the salt intake of populations in an effort to minimise the rising burden of cardiovascular disease (Lozano 2012; Watts 2012), concerns have been raised that programmes to reduce salt consumption could have an adverse impact on programmes to prevent IDDs (WHO 2007b). However, iodine fortification levels can be increased in salt to adjust for the recommended reduction in intake to less than 5g/d, ensuring ongoing compatibility of both programmes (WHO 2007b). Robust monitoring of both salt intake and salt iodisation at the country level, to enable adjustment of salt iodisation over time, will ensure individuals consuming the recommended amount of salt also continue to consume sufficient iodine. To optimise both the salt fortification and salt reduction programmes, policy makers should take into account the food consumed, salt and iodine‐rich food sources, and nutritional iodine requirements of the population and vulnerable subpopulations (young children, pregnant and lactating women) (Campbell 2012; WHO 2008). The fortification of alternative vehicles may also be considered in order to increase the reach of iodine deficiency elimination programmes, provided large scale implementation is feasible.
The fortification of other food vehicles with iodine has been suggested and tested (WHO/FAO 2006). Potentially suitable staple food vehicles for iodine fortification in public health programmes include refined water, sugar, fish sauce, edible vegetable oils and fats, cereal grains, such as rice, wheat, and maize flours, condiments and seasonings, and powdered or liquid milk, all of which have been tested, with varying degrees of success (WHO/FAO 2006). Bread and bouillon cubes prepared with iodised salt as an ingredient have also been used (Delong 1997; Elnagar 1997;FSANZ 2012).
Although there is limited research regarding the feasibility of fortifying foods with iodine, the World Health Organization (WHO) has described the fortification of food with micronutrients as a valid means for reducing micronutrient malnutrition (WHO/FAO 2006). A fundamental requirement in the adoption of food fortification as a public health intervention is the selection of the most appropriate and suitable foods to serve as the vehicle for the nutrients. In general, the food needs to be consumed in constant quantities by the target population, to be affordable, and to be available all year round (WHO/FAO 2006). The selection of an appropriate food or vehicle may vary among countries, depending upon dietary patterns. The compatibility of iodine fortification with the food, the stability of iodine in the fortified food throughout the distribution process, and the relative cost of the specific fortification for each particular food are other important considerations that may also vary according to country and context (WHO/FAO 2006). Experimental and quasi‐experimental studies have been conducted to assess the effects of iodine fortification of water in Thailand; milk in Northern Europe, the United Kingdom, and the United States; sugar in Sudan; and animal fodder in Finland (WHO/FAO 2006).
How the intervention might work
It is proposed that prophylaxis and control of IDD through fortification of staple foods (other than salt) works directly by increasing the absorption of iodine in the gastrointestinal tract. This increases iodine stores in the thyroid, or in the mammary glands during pregnancy and lactation, to levels that are sufficiently high to prevent deficiencies (Brown‐Grant 1961).
In this way, staple food fortification with iodine (either in the form of iodates or iodides) is similar to that of universal salt iodisation, assuming the foods chosen for fortification have a wide reach in the community or region in which the intervention is targeted, and deliver iodine in the required quantities continuously and sustainably to the population.
Although iodine toxicity is uncommon, excessive intake can cause complications, such as iodine‐induced hyperthyroidism. This condition is generally resolved quickly with proper diagnosis and treatment (Todd 1999). There is no evidence of other significant adverse reactions to foods fortified with iodine, although little research has been done in this area. However, it is theoretically possible that reactions of iodine within foods could cause colour changes, and increase oxidative reactions that could reduce shelf‐life, and reduce bioavailability of other nutritionally important substances (Winger 2008).
The WHO/US Centers for Disease Control and Prevention’s logic model for micronutrient interventions in public health depicts the programme theory and plausible relationships between inputs and expected improvement in Millennium Development Goals, adaptable to a range of contexts (WHO/CDC 2011). The effectiveness of iodine fortification of foods and condiments other than salt, in a public health context, is likely to depend on several factors related to policies and legislation, including: production and supply of the fortified foods or condiments; the development of delivery systems for the fortified foods or condiments; the development and implementation of external and internal food quality control systems, and; the development and implementation of strategies for information, education, and communication for behaviour change among consumers. A generic logic model for micronutrient interventions that depicts these processes and outcomes is presented in (Figure 1).
1.
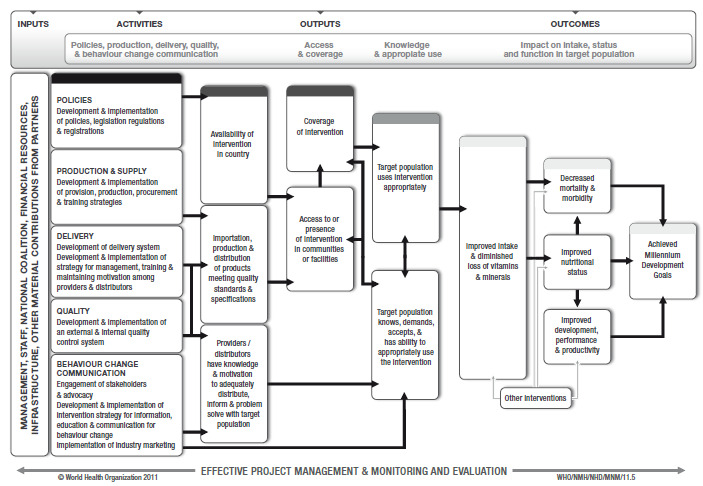
WHO/CDC logic model for micronutrients interventions in public health (with permission from WHO)
Why it is important to do this review
Inadequate iodine intake remains a public health concern in both developing and developed economies (Andersson 2012). At the population level, iodine deficiency also poses a significant development issue, impacting health and productivity, and hindering socioeconomic growth. In 2002, it was estimated that 2.5 million disability‐adjusted life years (DALYs) had been lost due to insufficient iodine intakes (WHO 2002). If current levels of iodine deficiency remain the same, it was estimated that future productivity losses due to intellectual impairment over the next five years would exceed USD 42.5 million (Aguayo 2003).
While significant improvements have been made following the implementation of universal salt iodisation programmes in the 1990s, monitoring by the United Nations Chidren's Emergency Fund (UNICEF) showed that since 2000, the proportion of households in the developing world that were consuming adequately‐iodised salt remained at 70% (UNICEF 2012). This highlights the challenges that many countries face in scaling‐up programmes and securing consumer acceptance, and points towards the further potential for complementary and targeted interventions for vulnerable groups. Despite this, to date, there has been no systematic assessment of the benefits and harms related to the fortification of foods (other than salt) with iodine to inform policy and assist countries in the design and implementation of integrated public health programmes to ensure adequate iodine intake. This systematic review set out to address the gap in information on this subject.
Objectives
To assess the effects of fortifying foods, beverages, condiments, or seasonings other than salt with iodine alone or in conjunction with other micronutrients, on iodine status and health‐related outcomes in all populations.
Methods
Criteria for considering studies for this review
Types of studies
We made minor changes to this section. See Differences between protocol and review.
We considered the following study types:
Randomised controlled trials (RCTs) with randomisation at either the individual or cluster level, including cross‐over trials;
Quasi‐RCTs, where allocation of treatment was made, for example, by alternate allocation, date of birth, alphabetical order, etc, or non‐RCTs;
Observational studies that were prospective and had a control group, including cohort studies, controlled before‐and‐after studies, and interrupted time series (ITS) with a clearly defined point‐in‐time when the intervention occurred, and at least three measure points both before and after the intervention.
Types of participants
We included all populations (including pregnant women) from any country.
Types of interventions
We made important changes to this section. See Differences between protocol and review.
We included iodine fortification of any food, beverage, condiment, or seasoning (other than salt) regardless of the technology used, for example:
Edible oils for household use (Codex 1981a; Codex 1981b; Codex 1999a);
Edible fats for household use (Codex 1981a);
White or brown sugar for household use (Codex 1999b);
Wheat flour or its sub‐products (Codex 1985a);
Maize flour or its sub‐products (Codex 1985b; Codex 1985c);
Milk and dairy products for household use (Codex 1999c);
Condiments and seasonings for household use (Codex 1995);
Bouillon and consommes (Codex 2001);
Fruit juices and nectars (Codex 2005).
We considered interventions to be eligible if the comparisons made included any of the following:
Foods, beverages, condiments or seasonings fortified with iodine alone versus the same unfortified foods, beverages, condiments or seasonings (for example: iodine‐fortified milk versus unfortified milk);
Foods, beverages, condiments or seasonings fortified with iodine alone versus no intervention (for example: iodine‐fortified milk versus no intervention);
Foods, beverages, condiments or seasonings fortified with iodine plus other micronutrients versus the same foods, beverages, condiments or seasonings with same level of fortification, apart from iodine (for example: iodine‐iron‐zinc‐fortified milk versus iron‐zinc‐fortified milk);
Foods, beverages, condiments or seasonings fortified with iodine plus other micronutrients versus no intervention (for example: iodine‐iron‐zinc‐fortified milk versus no intervention);
Foods, beverages, condiments or seasonings fortified with iodine plus other micronutrients versus the same foods, beverages, condiments or seasonings with different levels of fortification and excluding iodine (for example: iodine‐iron‐zinc‐fortified milk versus unfortified milk; iodine‐iron‐zinc‐fortified milk versus iron‐fortified milk; iodine‐iron‐zinc‐fortified milk versus zinc‐calcium‐fortified milk).
We assessed the eligibility of studies where iodine was cofortified with other micronutrients (Comparisons 3, 4, and 5 above), giving careful consideration of the outcomes reported in the studies. We did this to ensure that we could isolate the effects of iodine fortification on outcome measures. As such, we applied Comparison 3 to any of the listed outcome measures below, since the only difference between the treatment groups was the presence or absence of iodine. On the other hand, we only applied Comparisons 4 and 5 to outcome measures that were unlikely to be influenced by other micronutrients combined with iodine (i.e. goitre and urinary iodine concentration). If a study assessed either Comparison 4 or 5, but only measured outcomes that may be influenced by cofortification of iodine with other micronutrients (for example, physical development, mental development, and cognitive function or motor skill development), we excluded the study.
We excluded studies that examined iodine fortification of salt, as this was assessed by another review (WHO 2014; Wu 2002). We excluded studies that evaluated the effects of foods and beverages fortified with iodine through the addition of iodised salt as an ingredient in food production (e.g. bread, bouillon cubes, or dehydrated soups with iodised salt as an ingredient). We also excluded interventions that evaluated biofortification and point‐of‐use fortification or home fortification with multiple micronutrient powders, since these interventions involve techniques or processes that are different from conventional fortification (i.e. addition of nutrients during processing of foods). We excluded studies that assessed the effects of iodine supplementation, as they are out of the scope of this review and have been evaluated elsewhere (Angermayr 2004; Mahomed 2006).
Types of outcome measures
We made minor changes to this section. See Differences between protocol and review.
We included studies that assessed any of the following primary or secondary outcomes.
Primary outcomes
Death (all‐cause);
Goitre (as defined by trialists);
Physical development (as defined by trialists);
Mental development (as defined by trialists);
Cognitive function and motor skill development (as assessed by trialists, including Bayley Mental Development Index (MDI), Bayley Psychomotor Development Index (PDI), Stanford‐Binet Test, DENVER II Developmental Screening Test);
Cretinism (defined as intellectual disability with hearing loss, mutism, spastic diplegia, squint);
Hypothyroidism (as defined by trialists by reproductive failure, infertility, myxoedema (skin changes), tiredness, lethargy, slowing of mental function, cold intolerance, cardiac complications, or other);
Adverse effects (any reported by trialists, for example, iodine‐induced hyperthyroidism).
Secondary outcomes
Urinary iodine concentration (µg/L);
Thyroid‐stimulating hormone (TSH) concentration (mIU/L; measured in venous blood, capillary blood or neonatal cord blood);
Serum thyroglobulin concentration (µg/L; measured in venous blood, capillary blood or neonatal cord blood).
We also recorded outcome measures that were reported by trial authors, but not prespecified in the protocol (Land 2013).
Search methods for identification of studies
This section is the same as the protocol (Land 2013). The following international and regional databases were searched from their start date to January 2018.
Appendix 1 provides the full search strategy for CENTRAL, MEDLINE, Embase, Web of Science, and OpenGrey. We adapted the search strategy for the other databases, taking into account the differences in search terms and syntax rules. We did not apply any date or language restrictions. We translated potentially relevant articles written in language other than English to English prior to full eligibility assessment.
Electronic searches
International databases
Cochrane Public Health Group Specialised Register (searched January 2018);
Cochrane Central Register of Controlled Trials (CENTRAL) in the Cochrane Library (searched January 2018);
MEDLINE and MEDLINE (R) In Process Ovid (1946 to January 2018);
Embase Ovid (1947 to January 2018);
Web of Science Social Sciences Citation Index (1956 to January 2018); Science Citation Index (1900 to January 2018);
CINAHL EBSCO (Cumulative Index to Nursing and Allied Health Literature; 1982 to January 2018);
POPLINE (Population Information Online; searched January 2018);
AGRICOLA (Agricultural Online Access; agricola.nal.usda.gov/; searched January 2018);
BIOSIS Previews (1926 to January 2018);
FSTA Ovid (Food Science and Technology Abstracts; searched January 2018);
OpenGrey (System for Information on Grey Literature in Europe; searched January 2018);
Bibliomap and TRoPHI (Trials Register of Promoting Health Interventions; searched January 2018);
AGRIS (International System for Agricultural Science and Technology; agris.fao.org/; searched January 2018).
Regional databases
IBECS (ibecs.isciii.es/; searched January 2018);
Scielo (The Scientific Electronic Library Online; www.scielo.br/; searched January 2018);
Global Index Medicus ‐ AFRO (includes African Index Medicus); EMRO (includes Index Medicus for the Eastern Mediterranean Region; searched January 2018);
LILACS (Latin American and Caribbean Health Science Information database; 1982 to January 2018);
PAHO (Pan American Health Library; searched January 2018);
WHOLIS (WHO Library; searched January 2018);
WPRO (includes Western Pacific Region Index Medicus; searched January 2018);
IMSEAR (Index Medicus for the South‐East Asian Region; searched January 2018);
IndMED (Indian medical journals; indmed.nic.in/; searched January 2018);
Native Health Research Database (hscssl.unm.edu/nhd/; searched January 2018).
We handsearched the five journals that yielded the highest number of studies included in the review, within 12 months from the date of search (January 2018), to capture any article that may have not been indexed in the databases at the time of the search. In addition, we searched WorldCat, Networked Digital Library of Theses and Dissertations, DART‐Europe E‐theses Portal, Australasian Digital Theses Program, Theses Canada Portal, and ProQuest‐Dissertations and Theses to identify relevant theses. We also contacted experts in the field and lead authors, in addition to the Information Specialist of the Cochrane Public Health Group, to obtain further information. Lastly, we searched the International Clinical Trials Registry Platform (ICTRP) for any ongoing or planned trials.
Searching other resources
For assistance in identifying ongoing or unpublished studies, we contacted the Department of Nutrition for Health and Development and regional offices of the WHO, the nutrition section of the United Nations Children’s Emergency Fund (UNICEF), the World Food Programme (WFP), CDC, the US Agency for International Development (USAID) micronutrient programme, the Micronutrient Initiative (MI), the Global Alliance for Improved Nutrition (GAIN), Helen Keller International (HKI), the International Council for Control of Iodine Deficiency Disorders Global Network (IGN), and the Flour Fortification Initiative. We also searched the reference lists of all included articles and carried out related reference searches on ISI Web of Science (both the Social Science Citation Index and the Science Citation Index) for articles that cited the studies included in the review.
Data collection and analysis
Selection of studies
This section is substantively the same as the protocol (Land 2013).
Two reviewers (AC and SD, or JS and BM) independently screened the title and abstract of articles identified through the online searches. When a title or abstract could not be rejected with certainty, we obtained the full text of the article for further evaluation. We obtained all potentially relevant articles in full text, and further assessed them for eligibility, based on the inclusion and exclusion criteria. We resolved disagreements at any stage of the eligibility assessment process through discussion, and consultation with a third reviewer (M‐AL or KT).
Data extraction and management
We made minor changes to this section (Land 2013). See Differences between protocol and review.
Two review authors (JS and BM) independently extracted data onto a data extraction form adapted from the Cochrane Public Health and the Cochrane Effective Practice and Organisation of Care (EPOC) Groups (Cochrane PHG 2010; EPOC 2015). We piloted the form on a subset of articles to enhance consistency among data extractors. We extracted the following information from each included study, if available: study design, study setting, participants (including recruitment, number, characteristics), full description of the interventions examined, implementation of the intervention (including number of sites for an intervention, whether recruitment was similar at different sites, level of compliance, use of intervention in different sites, resources required for implementation, implementation cost, whether a process evaluation was conducted), results for our prespecified outcome measures (including a description of how and when they were measured), and other (nonspecified) outcomes. We resolved discrepancies in data extraction through discussion and consultation with a third review author (KT). We contacted study authors or co‐authors to request clarification of unclear data, and obtain additional information on missing data.
One review author (JS) entered data into Review Manager 5 (RevMan 5) software (RevMan 2014). A second (BM) and a third (KT) review author checked the data for accuracy. We resolved discrepancies through discussion.
We had intended to use the PROGRESS (place of residence, race, occupation, gender, religion, education, socioeconomic status, social status) framework to determine if outcome data had been reported with sociodemographic characteristics known to be important from an equity perspective, however, the data did not permit this.
Assessment of risk of bias in included studies
We made important changes to this section (Land 2013). See Differences between protocol and review.
Two review authors (JS and BM) independently assessed the risk of bias in all included studies using the Cochrane 'Risk of bias' tool (Higgins 2011). We assessed both RCTs and non‐RCTs against seven domains: random sequence generation (selection bias), allocation concealment (selection bias), blinding of participants and personnel (performance bias), blinding of outcome assessment (detection bias), incomplete outcome data (attrition bias), selective reporting (reporting bias), and other potential sources of bias. For non‐RCTs, we assessed the domain 'other potential sources of bias' based on the similarity of baseline characteristics between groups, similarity of baseline outcome measurements, presence of contamination, and whether data clustering was taken into account in the analyses. We resolved disagreements in assessment by discussion and by consulting a third review author (KT).
For studies that reported more than one outcome measure (for example, physical development and urinary iodine concentration), we made individual assessments for each outcome. We determined the overall risk of bias for each domain based on the worst rating (i.e. highest risk of bias) across outcome measures. For instance, if a study was assessed as having low risk of bias for the 'blinding of outcome assessment' domain for one outcome (for example, urinary iodine concentration), but scored high risk for another outcome (for example, physical development), the overall assessment for the 'blinding of outcome assessment' for that study was high risk of bias.
In addition, we summarised the overall risk of bias by study. Studies at high risk of bias were those with high or unclear risk of bias in the following domains: allocation concealment, incomplete outcome data, and other potential sources of bias. We also considered the likely magnitude and direction of bias in the assessments, and whether it was likely to impact on the findings of the study.
Where applicable, we assessed the certainty of the evidence for each outcome using the GRADE approach, which involves consideration of risk of bias, inconsistency, indirectness, imprecision, and publication bias (Balshem 2011). We expressed the results as one of four levels of quality: high, moderate, low, or very low. We started at a GRADE rating of high quality for RCTs and low quality for non‐RCTs, and downgraded by one level for serious or two levels for very serious study limitations (risk of bias), important inconsistency, indirectness of evidence, imprecise data, and potential publication bias. We used the GRADE profiler software to generate the 'Summary of findings' table for all prespecified outcome measures, in order of importance, as listed in the Types of outcome measures section (GRADEpro GDT 2015).
Measures of treatment effect
We made minor changes to this section (Land 2013). See Differences between protocol and review.
For continuous data, we calculated the overall effect estimate as the mean difference (MD), with 95% confidence interval (CI), between the intervention group and the comparison group. We combined the results of studies that reported postintervention data and studies that reported change‐from‐baseline data (i.e. change from pre‐intervention to postintervention in the intervention group and the control group) in a single meta‐analysis, if the outcomes were measured using the same scale. If both were reported, we included postintervention data in the analysis, unless the change‐from‐baseline data was derived from an analysis of covariance (ANCOVA) (Higgins 2011). For studies with multiple data points (more than one follow‐up period), we included the last assessment in the primary analysis, but reran the analysis including alternative postintervention periods as a sensitivity check. We converted standard error (SE) and CI (of group means or of change estimates) to standard deviation (SD) following the equations defined in the Cochrane Handbook for Systematic Reviews of Interventions (Higgins 2011). For studies that only reported median and range, we converted them to mean and SD using the equations proposed by Hozo and Bland (Bland 2015; Hozo 2005). In addition, for studies that only reported interquartile ranges, or the 10th and 90th percentile, we followed the same equation by Hozo (Hozo 2005), but adjusted the formula by a factor of 0.225 for the interquartile range and 0.43 for the range between the 10th and 90th percentile, as recommended by our statistician (LB). For outcomes measured using different methods or scales, we reported the standardised mean difference (SMD) with 95% CI. We re‐expressed the SMD to a particular scale or unit by multiplying it by the pooled baseline SD of the treatment groups in one of the studies (Higgins 2011).
For dichotomous data, we reported proportions, and expressed the overall effect estimate as odds ratio (OR) with 95% CIs. Where it was not possible to pool the results in a meta‐analysis, we presented a narrative summary of the outcomes provided in the included studies.
We had intended to include information on the impact of interventions by sociodemographic characteristics based on the PROGRESS framework, but the data did not permit this.
Unit of analysis issues
We made minor changes to this section (Land 2013). See Differences between protocol and review.
Clustered trials
We calculated the trial's effective sample size to account for the effect of clustering in data, using the formula provided in the Cochrane Handbook for Systematic Reviews of Interventions (Higgins 2011). We used an intra‐cluster correlation (ICC) coefficient of 0.02 to derive the design effect, but also carried out a sensitivity analysis using an ICC of 0.05 to check the robustness of our estimates (Killip 2004). We applied a common design effect across intervention groups.
Studies with more than two treatment groups
For studies with more than two intervention groups (multi‐arm studies), where appropriate and possible, we combined groups to create a single pairwise comparison, applying the equations set out in the Cochrane Handbook for Systematic Reviews of Interventions (Higgins 2011). If the comparison group was shared by two or more study arms that could not be combined (for example, if the type of food fortified with iodine, or the amount of iodine provided to the participants was different across the intervention groups), we divided the sample size of the control group over the number of relevant intervention groups to avoid double counting the participants.
Cross‐over trials
As a sensitivity check, we combined the results from the single cross‐over trial identified in this review with other RCTs. In the analysis, we included the cross‐over trial as if it was a parallel group trial of intervention and control (Higgins 2011).
Dealing with missing data
We made minor changes to this section (Land 2013). See Differences between protocol and review.
We noted missing and incomplete outcome data for included studies on the data extraction form. We estimated missing summary data using other information presented in the paper. When this was not possible, we contacted study authors or country contacts to obtain the missing information; however, our attempts were unsuccessful.
We had intended to carry out analyses on an intention‐to‐treat basis (i.e. include all participants randomised to each group in the analyses, including those who were lost to follow‐up), however, imputing outcomes was not possible due to lack of access to raw participant data. Instead, we conducted an available case analysis, including data on participants whose results were available (Higgins 2011). We considered the possible impact of missing data on the findings of the review in the interpretation of the results.
Assessment of heterogeneity
This section was substantively the same as the protocol (Land 2013).
We examined the forest plots from the meta‐analyses and visually assessed the level of heterogeneity in terms of the size or direction of treatment effect among studies. We calculated the I² statistic to quantify inconsistency across studies. If substantial heterogeneity was present, we explored possible causes by conducting subgroup analyses (Higgins 2011). We exercised caution in the interpretation of results with high levels of unexplained heterogeneity.
Assessment of reporting biases
We made minor changes to this section (Land 2013). See Differences between protocol and review.
We had intended to generate and visually examine funnel plots to assess potential publication bias, however, the limited number of studies in the analyses (less than 10 studies) did not permit this. Where we pooled studies in a meta‐analysis, we ordered them in terms of weight (size of trial), to allow us to visually examine the forest plots and assess whether the results from smaller and larger studies were similar, or if there were any apparent differences (i.e. we checked whether the effect size was similar in smaller and larger studies).
Data synthesis
We made minor changes to this section (Land 2013). See Differences between protocol and review.
We carried out a random‐effects meta‐analysis to combine data and generate an overall estimate of treatment effect, when more than one study examined the same outcome. We derived pooled summary estimates using the DerSimonian and Laird inverse‐variance method for continuous outcome, and the Mantel‐Haenszel method for dichotomous outcome in RevMan 5 (DerSimonian 1986; Mantel 1959; RevMan 2014).
We did not combine the results of RCTs and studies of different design in meta‐analyses. Where there was evidence regarding a particular outcome from both randomised and non‐randomised trials, we presented both results, but used the evidence from trials that were at a lower risk of bias to estimate treatment effect.
We included all studies in the primary analysis, regardless of risk of bias. We provided descriptions of risk of bias of each study in the results section, and considered the risk of bias for each outcome measure using the GRADE approach in the interpretation of results.
Where it was not possible to combine study outcomes in a meta‐analysis, we synthesized the results in a narrative format.
Subgroup analysis and investigation of heterogeneity
We made minor changes to this section (Land 2013). See Differences between protocol and review.
We had intended to assess differences by salt consumption patterns (< 5 g/day, or 5 g/day to 9.9 g/day, or 10 g/day to 14.9 g/day, or ≥15 g/day, or unreported), and by availability of fortified salt in the population (in households only, or in processed foods only, or in households and processed foods, or universal salt iodisation, or unknown), however, the studies did not report this information.
Hence, we conducted post‐hoc subgroup analyses to examine differences between subgroups and determine possible sources of heterogeneity, according to the following:
Age group, years: < 18 years old or ≥ 18 years old;
Trial duration, weeks: < 20 weeks or ≥ 20 weeks (this cut‐off was used in view of dividing the studies and participants equally into two subgroups to maximise statistical power in the analysis);
Daily iodine dose provided by the intervention, µg/day: < 120 µg/day or ≥ 120 µg/day;
Percentage with iodine deficiency at baseline (iodine deficiency defined as median urinary iodine concentration of < 100 µg/L), %: < 50%, ≥ 50%, or unreported;
Type of fortification: subgroups based on the five comparisons considered in this review grouped into two: iodine alone or cofortification of iodine with other micronutrients.
Sensitivity analysis
We made minor changes to this section (Land 2013). See Differences between protocol and review.
We conducted several sensitivity analyses to determine the robustness of our conclusions, based on the issues we identified during the review process. These included:
Using alternative postintervention data points;
Using different ICCs to calculate the design effect and effective sample size of clustered trials;
Combining the results of RCTs and the single cross‐over trial identified in this review;
Excluding studies at high risk of bias (i.e. studies with high or unclear risk of bias in allocation concealment, incomplete outcome data, and other potential sources of bias).
Results
Description of studies
Results of the search
The search identified 2063 records from electronic database search, and 24 additional records through contact with experts, lead authors and organizations, and handsearching. After removing duplicates and irrelevant records, we screened 129 abstracts, 35 of which were considered potentially relevant (Figure 2). We excluded 24 of these 35 studies after full‐text check for the following reasons: intervention did not meet criteria for inclusion (N = 10); absence of a control group (N = 7); product development studies (N = 4); cofortification of iodine with other micronutrients, but outcomes assessed not specific to iodine (N = 2), and; not relevant (N = 1). Ultimately, we included 11 studies, which provided 14 comparisons (see Included studies).
2.
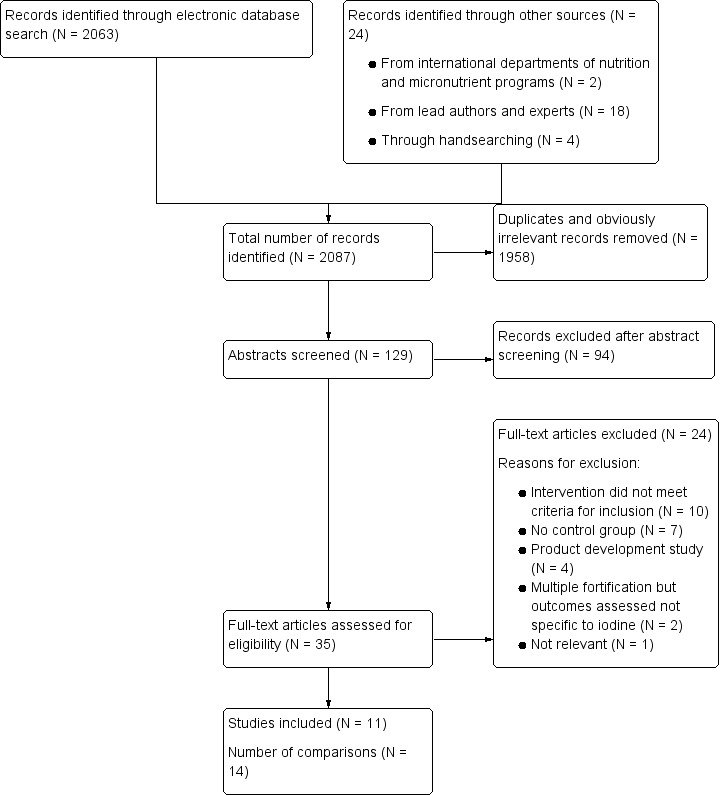
Study flow diagram
Included studies
Details on included studies are presented in the Characteristics of included studies table.
Location
Based on the World Bank's list of economies, two studies were from high‐income countries, nine from middle‐income countries (six from upper‐middle‐, and three from lower‐middle‐income countries), and none from low‐income countries. Three studies were conducted in Thailand (Pongpaew 1998a; Saowakhontha 1994a; Winichagoon 2006), and one each in Bangladesh (Sazawal 2013), Iran (Nazeri 2017), Kuwait (Biebinger 2009), Philippines (Solon 2003), Russia (Danilenko 2015), South Africa (van Stuijvenberg 1999), Switzerland (Dold 2016a), and Vietnam (Nga 2009).
Study design
Seven studies were randomised controlled trials (RCTs (Biebinger 2009; Nazeri 2017; Nga 2009; Sazawal 2013; Solon 2003; van Stuijvenberg 1999; Winichagoon 2006), and three were cluster non‐RCTs (Danilenko 2015; Pongpaew 1998a; Saowakhontha 1994a). One study used a randomised cross‐over design (Dold 2016a; Dold 2016b). Three studies had multiple intervention arms (Dold 2016a; Pongpaew 1998a; Saowakhontha 1994a).
Participants
A total of 4317 participants were included in the 11 studies. Sample sizes ranged from 33 to 1010, with a median sample size of 279 (interquartile range of 181 to 569). Seven studies were carried out among school children (age range: 6 to 12 years; N = 3636; Danilenko 2015; Nga 2009; Pongpaew 1998a; Sazawal 2013; Solon 2003; van Stuijvenberg 1999; Winichagoon 2006), three among women of reproductive age (age range: 15 to 45 years; N = 648; Biebinger 2009; Nazeri 2017; Saowakhontha 1994a), and one among infants aged two to five months (N = 33 observations; Dold 2016a). Excluding the three studies that only included women, the proportion of female participants was about 50% across the studies, apart from two studies where it was not reported (Danilenko 2015; Pongpaew 1998a). Six studies involved participants with high iodine deficiency at baseline (i.e. proportion with urinary iodine concentration < 100 µg/L is ≥ 50%; Danilenko 2015; Nazeri 2017; Saowakhontha 1994a; Solon 2003; van Stuijvenberg 1999; Winichagoon 2006), while three studies included participants with low iodine deficiency at baseline (Nga 2009; Pongpaew 1998a; Sazawal 2013). The other two studies did not report prevalence of iodine deficiency (Biebinger 2009; Dold 2016a).
Intervention
Type of food, beverage, condiment, or seasoning fortified with iodine
The included studies were diverse in terms of the type of food used as the vehicle for iodine delivery. Three studies used biscuits (Biebinger 2009; Nga 2009; van Stuijvenberg 1999); two studies each used milk (Danilenko 2015; Nazeri 2017), fish sauce (Pongpaew 1998a; Saowakhontha 1994a), and drinking water (Pongpaew 1998a; Saowakhontha 1994a); and one study each used yoghourt (Sazawal 2013), fruit beverage (Solon 2003), seasoning powder (Winichagoon 2006), and infant formula milk (Dold 2016a).
Daily iodine intake and frequency
The daily amount of iodine provided to the participants in the fortified food ranged from 35 µg/day to 220 µg/day. Six intervention arms administered < 120 µg/day of iodine (Danilenko 2015; Dold 2016a; Nga 2009; Sazawal 2013; Solon 2003; Winichagoon 2006), while eight intervention arms provided ≥ 120 µg/day (Biebinger 2009; Dold 2016b; Nazeri 2017; Pongpaew 1998a; Pongpaew 1998b; Saowakhontha 1994a; Saowakhontha 1994b; van Stuijvenberg 1999). In most studies, the fortified product was consumed by the participants once daily, five to seven days a week, apart from three studies (twice a day, five days a week (Solon 2003); once a day, once a week (Danilenko 2015); fed infants as needed (Dold 2016a)).
Trial duration
Overall, trial duration across the included studies ranged from 11 days to 48 weeks. Four studies supplied the fortified food, beverage, condiment, or seasoning to the participants for a period < 20 weeks (Dold 2016a; Nazeri 2017; Nga 2009; Solon 2003), while the remaining studies provided the fortified product longer. By age group, trial duration was between 16 to 48 weeks among school children, four to 24 weeks among women of reproductive age, and 11 days for the single study conducted among infants. Three studies reported multiple post‐intervention data points (Nazeri 2017; Saowakhontha 1994a; van Stuijvenberg 1999).
Comparison
No trial assessed Comparison 3 (food fortified with iodine plus other micronutrients versus the same food with the same level of fortification apart from iodine), and Comparison 4 (food fortified with iodine plus other micronutrients versus no intervention). Two studies assessed Comparison 1 (food fortified with iodine alone versus the same food unfortified (Danilenko 2015; Dold 2016a)), three studies assessed Comparison 2 (food fortified with iodine alone versus no intervention (Nazeri 2017; Pongpaew 1998a; Saowakhontha 1994a)), and six studies assessed Comparison 5 (food fortified with iodine plus other micronutrients versus the same food with different levels of fortification and excluding iodine (Biebinger 2009; Nga 2009; Sazawal 2013; Solon 2003; van Stuijvenberg 1999; Winichagoon 2006)).
For studies where cofortification of iodine with other micronutrients was present, the micronutrients co‐administered included: iron (Biebinger 2009); iron, zinc, and vitamin A (Nga 2009; Sazawal 2013; Winichagoon 2006); iron, ß‐carotene, and vitamin C (van Stuijvenberg 1999); and iron, zinc, vitamin A, vitamin C, riboflavin, folic acid, vitamin B6, vitamin B12, vitamin E, and niacin (Solon 2003). It is important to note that two trials were factorial in design, investigating the effects of food fortification (with or without fortification) in combination with anthelmintic therapy (with or without anthelmintic therapy (Nga 2009; Solon 2003)).
Outcome measures
No trial assessed the primary outcomes of death, cretinism, or hypothyroidism, or the secondary outcomes of TSH concentration or serum thyroglobulin concentration. Two studies assessed goitre prevalence (Pongpaew 1998a; van Stuijvenberg 1999). Four studies reported physical development measures postintervention, including height, weight, weight‐for‐age z score, height‐for‐age z score, weight‐for‐height z score, and body mass index z‐score (Pongpaew 1998a; Sazawal 2013; Solon 2003; van Stuijvenberg 1999), however, only one study had an eligible comparison (Pongpaew 1998a). Two studies measured mental development and cognitive function scores, however, both had ineligible comparisons (Solon 2003; van Stuijvenberg 1999). One study reported adverse effects (Dold 2016a). All studies assessed urinary iodine concentration, which was reported in several different units.
See Characteristics of included studies table for details on the comparisons and outcome measures considered for each study, groups, or intervention arms combined in the meta‐analysis for studies with multiple intervention arms, equations used for converting urinary iodine concentration to a standard unit, and computation of effective sample size for clustered studies.
Excluded studies
Details on excluded studies are presented in the Characteristics of excluded studies table. Reasons for exclusion included the following: intervention did not meet criteria for inclusion (Abuye 1995; Garber 1992; Garber 1993; Kallioinen 2017; Liu 2015; Pichard 1991; Stos 2015; Tazhibayev 2008; Thakwalakwa 2015; Untoro 2006); absence of a comparison group (Eltom 1995; Foo 1996; Goyle 2011; Koryachkina 2015; Sukhinina 1997; Tulyathan 2009; van Stuijvenberg 2001); product development studies (Alexy 2009; Asonye 2001; Chavasit 1998; Chavasit 2003); cofortification of iodine with other micronutrients but outcomes assessed not specific to iodine (Goyle 2012; Phuka 2008); and not relevant (Brantsaeter 2009).
Risk of bias in included studies
The judgements on each risk of bias domain for each included study are presented in the Characteristics of included studies table, and are summarised in Figure 3. Note that three studies had multiple intervention arms (Dold 2016a; Pongpaew 1998a; Saowakhontha 1994a), and although the comparisons were included separately in the figure, they were counted as one in the summary to avoid double counting the study.
3.
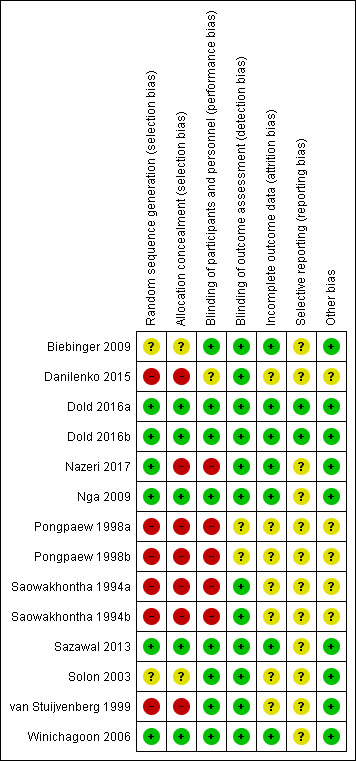
Risk of bias summary: review authors' judgements about each risk of bias item for each included study
Overall, only one study had low risk of bias for the seven bias domains (Dold 2016a). Seven studies had an overall rating of high risk of bias, based on the presence of high or unclear risk of bias in allocation concealment, incomplete outcome data, and other sources of bias (Biebinger 2009; Danilenko 2015; Nazeri 2017; Pongpaew 1998a; Saowakhontha 1994a; Solon 2003; van Stuijvenberg 1999). Of these, one study had unclear or high risk of bias for the seven bias domains (Pongpaew 1998a). The remaining three studies had low risk of bias for all domains, apart from selective outcome reporting (Nga 2009; Sazawal 2013; Winichagoon 2006).
By bias domain, the number of studies (out of 11 studies) we scored as having unclear or high risk were: six (55%) on random sequence generation, seven (64%) on allocation concealment, four (36%) on blinding of participants and personnel, one (9%) on blinding of outcome assessment, five (45%) on incomplete outcome data, 10 (91%) on selective reporting, and three (27%) on other sources of bias.
Allocation
We assessed four studies to be at high risk of bias on random sequence generation (Danilenko 2015; Pongpaew 1998a; Saowakhontha 1994a; van Stuijvenberg 1999). The van Stuijvenberg 1999 study used a systematic approach, using alphabetic class lists to assign participants to treatment groups, while the other three studies were non‐RCTs. We scored two studies as having unclear risk due to inadequate information provided to permit judgement (i.e. the authors mentioned that participants were randomly assigned to groups, but did not mention the sequence generation process (Biebinger 2009; Solon 2003)). The five studies that scored low risk of bias for this domain generated a random sequence through a computer software (Dold 2016a; Nga 2009; Sazawal 2013; Winichagoon 2006), or a random number table (Nazeri 2017).
Five studies had high risk of bias on allocation concealment due to a non‐randomised study design (Danilenko 2015; Pongpaew 1998a; Saowakhontha 1994a), or the use of an open allocation schedule, or a predictable sequence (pre‐determined direction for reading a random number table and use of alphabetic class lists (Nazeri 2017; van Stuijvenberg 1999)). Two studies did not report information about allocation concealment (Biebinger 2009; Solon 2003). The four studies that scored low risk of bias on this domain adequately concealed allocations prior to assignment through central allocation (Winichagoon 2006), or through use of codes or products that were identical in appearance (Dold 2016a; Nga 2009; Sazawal 2013).
Blinding
We scored three studies as having high risk of bias on blinding of participants and personnel (Nazeri 2017; Pongpaew 1998a; Saowakhontha 1994a). In these studies, it was not possible to blind participants and personnel since the interventions provided across intervention groups were different. One study had unclear risk of bias due to absence of information (Danilenko 2015). We assessed the remaining seven studies to be at low risk of bias.
In terms of blinding of outcome assessment, all but one study scored low risk of bias (Pongpaew 1998a). However, it must be noted that apart from two studies (Pongpaew 1998a; van Stuijvenberg 1999), the studies only included one eligible outcome measure, which was urinary iodine concentration. The review authors considered this outcome as an objective measure and unlikely to be influenced by lack of blinding, so we scored the studies as low risk of bias, regardless of whether blinding of outcome assessment was reported or not. The van Stuijvenberg 1999 study assessed two outcomes (goitre and urinary iodine concentration), and scored low risk for both, hence, we gave an overall rating of low risk of bias on this domain. On the other hand, Pongpaew 1998a assessed three outcomes (goitre, urinary iodine concentration, and physical development measures) and we scored an unclear risk for the assessment of goitre and physical development measures, hence, giving an overall rating of unclear risk of bias on this domain.
Incomplete outcome data
We scored five studies as having unclear risk of bias on incomplete outcome data, due to either lack of information on the number of participants included to permit a judgement about missing outcome data, or lack of information on reasons for missing outcome data (Danilenko 2015; Pongpaew 1998a; Saowakhontha 1994a; Solon 2003; van Stuijvenberg 1999). Losses to follow‐up and reasons for missing outcome data were provided by the remaining six studies.
Selective reporting
We scored all but one study as unclear risk of bias for selective reporting (Dold 2016a). The Nazeri 2017 study did not provide sufficient information on why the results for one time point were missing, while the remaining studies did not have a protocol to allow judgement as to whether all prespecified outcomes had been reported.
Other potential sources of bias
We assessed three studies as having unclear risk of bias for this domain (Danilenko 2015; Pongpaew 1998a; Saowakhontha 1994a). These studies were cluster non‐RCTs that did not account for data clustering in the analysis. In addition, in Saowakhontha 1994a, there appeared to be an imbalance in the prevalence of goitre between the villages (clusters) at baseline. On the other hand, Danilenko 2015 did not provide information on baseline characteristics of the intervention and the control groups to allow us to assess baseline imbalance.
The cross‐over study was assessed to be free of other sources of bias (Dold 2016a). The review authors considered the cross‐over design to be suitable for the question being addressed by the study, and that carry‐over effect was adequately addressed by having enough days for run‐in, balance, and run‐out periods. The remaining seven studies were free of other potential sources of bias.
Effects of interventions
See: Table 1
Primary outcomes
No study evaluated the effects of iodine fortification on death (all cause), mental development (as defined by trialists), cognitive function (as assessed by trialists), cretinism, or hypothyroidism.
Goitre
One RCT (van Stuijvenberg 1999), and one non‐RCT (Pongpaew 1998a), provided relevant data on the effect of iodine fortification on the prevalence of goitre among school children. The van Stuijvenberg 1999 study reported that "the prevalence of goitre did not decrease after 12 months of iodine fortification" from preintervention values of 20.0% (23 of 115) in the intervention group and 22.1% (25 of 113) in the control group; however, the study did not report the actual frequencies or percentages postintervention. The Pongpaew 1998a study provided two comparisons, and the pooled estimate showed uncertain effects of iodine fortification on goitre prevalence (odds ratio (OR) 1.60, 95% confidence interval (CI) 0.60 to 4.31; one trial, 83 participants; Analysis 1.1; Figure 4). The quality of evidence for goitre was very low for both the RCT and non‐RCT due to limitations in study design (risk of bias; downgraded two levels) and imprecise data (downgraded one level). See Table 1.
1.1. Analysis.
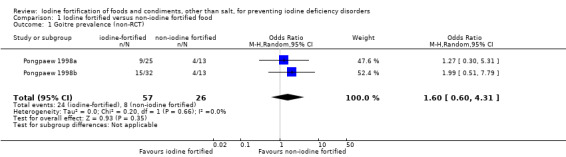
Comparison 1 Iodine fortified versus non‐iodine fortified food, Outcome 1 Goitre prevalence (non‐RCT).
4.
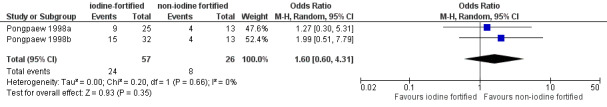
Forest plot of comparison 1. Iodine fortified versus non‐iodine fortified product; outcome: 1.1 Goitre prevalence
Physical development
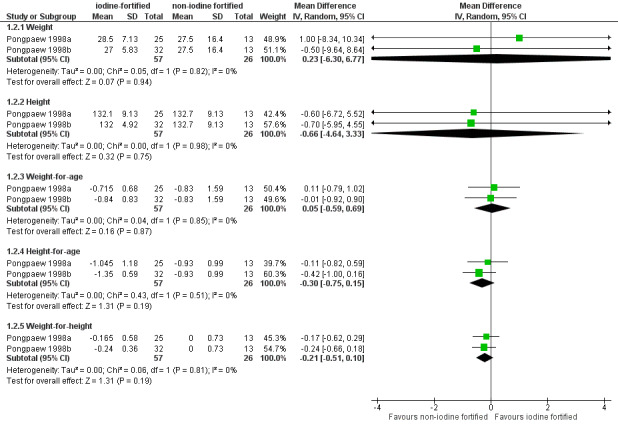
One non‐RCT (83 participants) provided data to examine the effect of iodine fortification on five physical development measures: weight (kg), height (cm), weight‐for‐age, height‐for‐age, and weight‐for‐height scores (Pongpaew 1998a). The effect of iodine fortification compared to control on any of the physical development measures was uncertain: weight (mean difference (MD) 0.23 kg, 95% CI ‐6.30 to 6.77); height (MD ‐0.66 cm, 95% CI ‐4.64 to 3.33); weight‐for‐age (MD 0.05, 95% CI ‐0.59 to 0.69); height‐for‐age (MD ‐0.30, 95% CI ‐0.75 to 0.15); and weight‐for‐height (MD ‐0.21, 95% CI ‐0.51 to 0.10; Analysis 1.2; Figure 5). The quality of evidence for this outcome was very low, since all information was from a single non‐RCT assessed to be at high risk of bias (downgraded two levels), and the results were imprecise (downgraded one level). See Table 1.
1.2. Analysis.
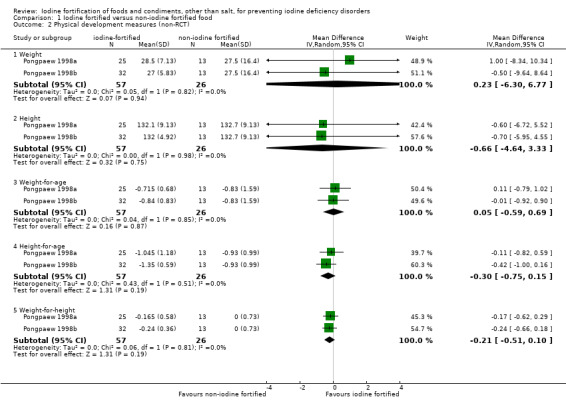
Comparison 1 Iodine fortified versus non‐iodine fortified food, Outcome 2 Physical development measures (non‐RCT).
5.
Forest plot of comparison 1. Iodine fortified versus non‐iodine fortified product; outcome: 1.2 Physical development measures
Adverse effects
The cross‐over trial reported narratively that there were no adverse effects observed during the study (Dold 2016a). We rated the quality of the evidence as low, due to indirectness (downgraded one level) and imprecise data (downgraded one level). See Table 1.
Secondary outcomes
No study assessed the secondary outcomes of TSH concentration or serum thyroglobulin concentration.
Urinary Iodine Concentration
Eleven studies assessed urinary iodine concentration, measured using spot urine samples. Of these, two studies were excluded from the primary analysis (Dold 2016a; Winichagoon 2006). The Winichagoon 2006 study included geometric means without a measure of variability. The study reported a geometric mean of 74.4 µg/L in the iodine‐fortified group (278 participants) and a geometric mean of 53.6 µg/L in the control group (282 participants) postintervention. Further, the study showed that urinary iodine concentration was, on average, 43% higher in the iodine‐fortified group compared to the control group, after taking into account age, sex, school, and baseline outcome levels (ß‐coefficient 1.43, 95% CI 1.21 to 1.68). The Dold 2016a study (11 participants) used a cross‐over design, and described the mean iodine concentration for each group: low‐iodine group (97.27 µg/L, standard deviation (SD) 14.96 µg/L); medium‐iodine group (212.11 µg/L, SD 37.76 µg/L); and high‐iodine group (397.94 µg/L, SD 68.38 µg/L). Estimates from the Dold 2016a study were included in the meta‐analysis as a sensitivity check, presented in the succeeding section. Estimates from the Winichagoon 2006 study were not included in any of the analyses, as it was not possible to convert geometric mean to arithmetic mean, and they did not provide a measure of variability.
Of the remaining nine studies, six were RCTs (Biebinger 2009; Nazeri 2017; Nga 2009; Sazawal 2013; Solon 2003; van Stuijvenberg 1999), and three were non‐RCTs (Danilenko 2015; Pongpaew 1998a; Saowakhontha 1994a). Among the RCTs, one study reported change‐from‐baseline scores (Sazawal 2013). Among the non‐RCTs, one study expressed urinary iodine concentration as µmol/g creatinine; we were unable to convert the values to µg/L, since the creatinine level for each group was not reported (Saowakhontha 1994a). Hence, for this outcome measure, we reported the standardised mean difference (SMD) with 95% CI. We re‐expressed the SMD in µg/L by multiplying it by the pooled baseline SD of 64.95 µg/L from the Nga 2009 study. This study was selected based on sample size and risk of bias.
The meta‐analysis of RCTs showed that iodine fortification of food significantly increased urinary iodine concentration (SMD 0.59, 95% CI 0.37 to 0.81; six trials, 2032 participants; I² = 81%; Analysis 1.3; Figure 6; moderate‐quality evidence). This is equivalent to a mean difference of 38.32 µg/L (95% CI 24.03 to 52.61 µg/L). This effect size can be considered a moderate effect, according to conventional cut‐offs (Higgins 2011). The quality was downgraded due to limitations in study design (downgraded one level). See Table 1.
1.3. Analysis.
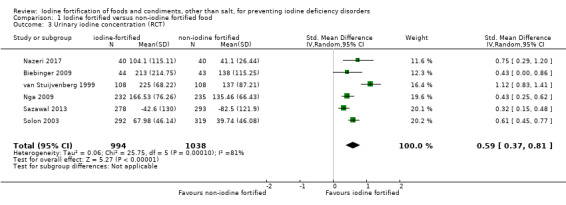
Comparison 1 Iodine fortified versus non‐iodine fortified food, Outcome 3 Urinary iodine concentration (RCT).
6.
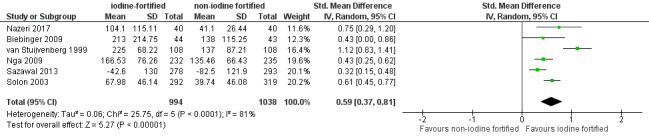
Forest plot of comparison 1. Iodine fortified versus non‐iodine fortified food; outcome: 1.3 Urinary iodine concentration (RCT)
On the other hand, the meta‐analysis of non‐RCTs, with five comparisons, showed that the effect of iodine fortification of food on urinary iodine concentration was uncertain (SMD 0.25, 95% CI ‐0.16 to 0.66; three trials, 262 participants; I² = 55%; Analysis 1.4; Figure 7), showing a mean difference of 16.23 µg/L (95% CI ‐10.39 to 42.87 µg/L). The quality of evidence from non‐RCTs was very low due to serious study limitations (downgraded two levels) and imprecise results (downgraded one level). See Table 1.
1.4. Analysis.
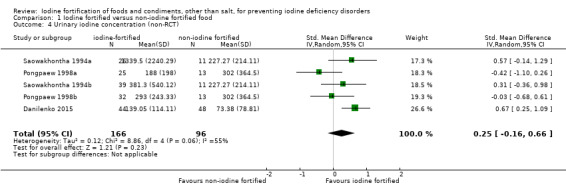
Comparison 1 Iodine fortified versus non‐iodine fortified food, Outcome 4 Urinary iodine concentration (non‐RCT).
7.
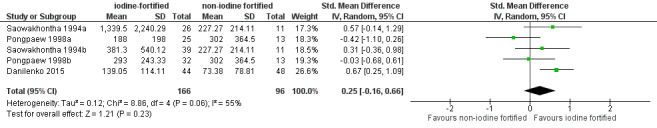
Forest plot of comparison 1. Iodine fortified versus non‐iodine fortified food; outcome: 1.4 Urinary iodine concentration (non‐RCT)
The heterogeneity for this outcome was substantial for the RCT meta‐analysis (I² = 81%), and moderate to substantial for the non‐RCT meta‐analysis (I² = 55%). We conducted post‐hoc subgroup analyses to explore possible sources of heterogeneity for the RCT analysis, but not for the non‐RCT analysis, given that the between‐study variability was much less compared to the former. We also wanted to avoid false positive findings due to multiple comparisons and false negative findings, due to small sample size (N = 262).
Subgroup analysis
We performed subgroup analyses according to age group (< 18 or ≥ 18 years old; Analysis 2.1), trial duration (< 20 or ≥ 20 weeks; Analysis 2.2), daily amount of iodine or dose provided by the intervention (< 120 or ≥ 120 µg/day; Analysis 2.3), percent with iodine deficiency at baseline (< 50, or ≥ 50%, or unknown; Analysis 2.4), and type of fortification (iodine alone or iodine plus other micronutrients; Analysis 2.5). The equivalent MDs and 95% CIs are shown in Table 2.
2.1. Analysis.
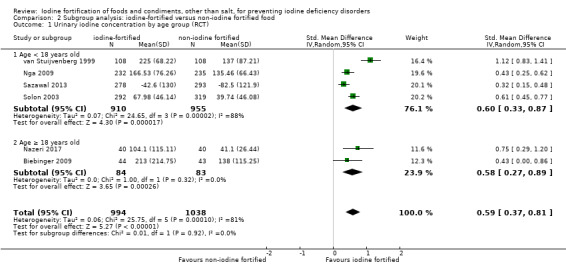
Comparison 2 Subgroup analysis: iodine‐fortified versus non‐iodine fortified food, Outcome 1 Urinary iodine concentration by age group (RCT).
2.2. Analysis.
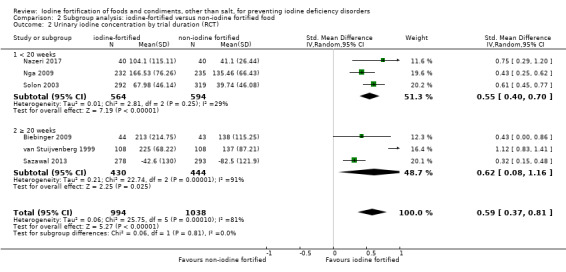
Comparison 2 Subgroup analysis: iodine‐fortified versus non‐iodine fortified food, Outcome 2 Urinary iodine concentration by trial duration (RCT).
2.3. Analysis.
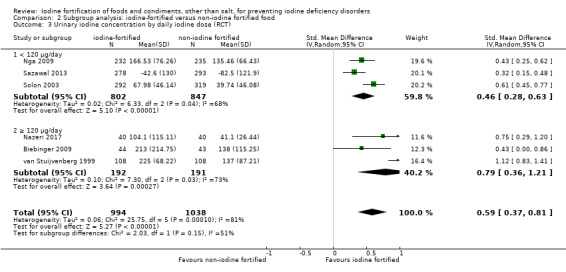
Comparison 2 Subgroup analysis: iodine‐fortified versus non‐iodine fortified food, Outcome 3 Urinary iodine concentration by daily iodine dose (RCT).
2.4. Analysis.
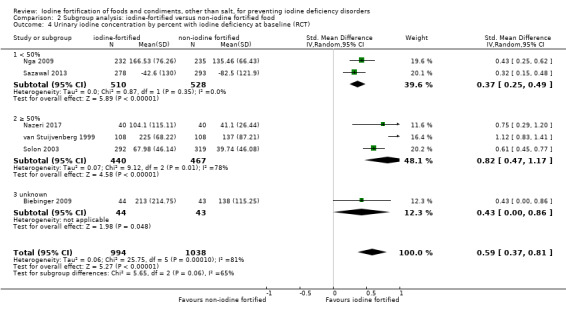
Comparison 2 Subgroup analysis: iodine‐fortified versus non‐iodine fortified food, Outcome 4 Urinary iodine concentration by percent with iodine deficiency at baseline (RCT).
2.5. Analysis.
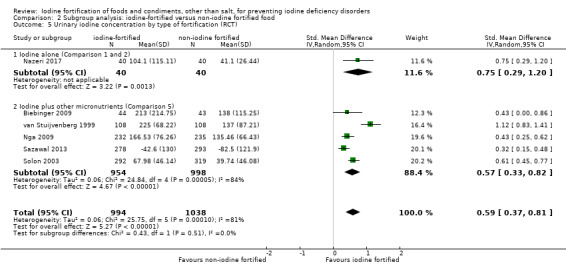
Comparison 2 Subgroup analysis: iodine‐fortified versus non‐iodine fortified food, Outcome 5 Urinary iodine concentration by type of fortification (RCT).
1. Pooled MDs in urinary iodine concentration by subgroup.
| Subgroup | MD (95% CI), µg/L |
| Age group | |
| < 18 years old | 38.97 (21.43 to 56.51) |
| ≥ 18 years old | 37.67 (17.54 to 57.81) |
| Trial duration | |
| < 20 weeks | 35.72 (25.98 to 45.47) |
| ≥ 20 weeks | 40.27 (5.20 to 75.34) |
| Intervention dose | |
| < 120 µg/day | 29.88 (18.19 to 40.92) |
| ≥ 120 µg/day | 51.31 (23.38 to 78.59) |
| Percentage of iodine deficient at baseline | |
| < 50% | 24.03 (16.24 to 31.83) |
| ≥ 50% | 53.26 (30.53 to 75.99) |
| Unknown | 27.93 (0.00 to 55.86) |
| Type of fortification | |
| Iodine alone (Comparison 1 and 2) | 48.71 (18.84 to 77.94) |
| Iodine plus other micronutrients (Comparison 5) | 37.02 (21.43 to 53.26) |
MDs in µg/L were obtained by multiplying the SMDs by the pooled baseline SD of 64.95 µg/L from the Nga 2009 study
Less heterogeneity was found in three subgroups (age ≥ 18 years old, I² = 0%; trial duration < 20 weeks, I² = 29%; and percent with iodine deficiency at baseline < 50%, I² = 0%), compared to their counterparts (age < 18 years old, I² = 88%; trial duration ≥ 20 weeks, I² = 91%; and percent with iodine deficiency at baseline ≥ 50, I² = 78%). Less heterogeneity was observed in both of the intervention dose subgroups (< 120 µg/day, I² = 68%; ≥ 120 µg/day, I² = 73%) compared to the overall analysis (I² = 81%), however, the level of heterogeneity was still substantial. We noted a higher degree of heterogeneity in the iodine plus other micronutrients subgroup (I² = 84%) compared to the overall analysis.
The potential benefit of iodine fortification on urinary iodine concentration was significant in all subgroups, apart from the subgroup where percent with iodine deficiency at baseline was unknown (SMD 0.43, 95% CI 0.00 to 0.86; 1 trial, 87 participants). There was no differential effect of iodine fortification on urinary iodine concentration by age group (P = 0.92), trial duration (P = 0.81), intervention dose (P = 0.15), percent with iodine deficiency at baseline (P = 0.06), and type of fortification (P = 0.51).
Sensitivity analysis
We conducted several sensitivity analyses to check the robustness of the results of the effects of iodine fortification on urinary iodine concentration.
Analysis using alternative postintervention data points
Two RCTs (van Stuijvenberg 1999; Nazeri 2017), and one non‐RCT (Saowakhontha 1994a), included multiple postintervention data points. We used the last assessment in the primary analysis, but reran the analysis with alternative postintervention data points as a sensitivity check. We included the only alternative postintervention data point available for the Saowakhontha 1994a (at three months) and van Stuijvenberg 1999 study (at six months). For the Nazeri 2017 study, we used the second‐to‐last postintervention data point (at two weeks). The pooled effects of iodine fortification on urinary iodine concentration did not change with these alternative data points for either the meta‐analysis of RCTs (SMD 0.73, 95% CI 0.36 to 1.09; six trials, 2032 participants; I² = 93%; Analysis 3.1) or non‐RCTs (SMD 0.00, 95% CI ‐0.47 to 0.47; three trials, 262 participants; I² = 66%; Analysis 3.2).
3.1. Analysis.
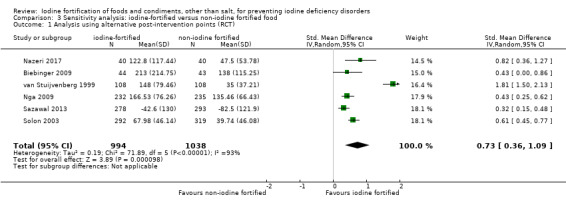
Comparison 3 Sensitivity analysis: iodine‐fortified versus non‐iodine fortified food, Outcome 1 Analysis using alternative post‐intervention points (RCT).
3.2. Analysis.
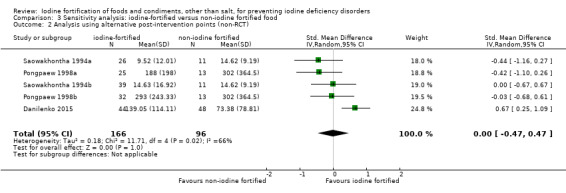
Comparison 3 Sensitivity analysis: iodine‐fortified versus non‐iodine fortified food, Outcome 2 Analysis using alternative post‐intervention points (non‐RCT).
Analysis using different ICCs for calculating the design effect and effective sample size of clustered studies
The only clustered studies included in this review were the three non‐RCTs (Danilenko 2015; Pongpaew 1998a; Saowakhontha 1994a). For the primary meta‐analysis of non‐RCTs, we used an ICC of 0.02 to calculate the design effect and effective sample size. In the sensitivity analysis, we used a higher ICC of 0.05, which did not change the effect observed in the primary analysis (SMD 0.30, 95% CI ‐0.09 to 0.70; three trials, 144 participants; I² = 15%; Analysis 3.3).
3.3. Analysis.
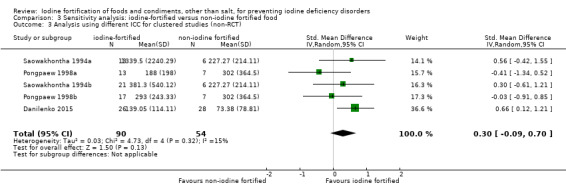
Comparison 3 Sensitivity analysis: iodine‐fortified versus non‐iodine fortified food, Outcome 3 Analysis using different ICC for clustered studies (non‐RCT).
Analysis including the cross‐over trial
The cross‐over trial included in this review reported the means and SDs of iodine concentration of each intervention group, and we included this in the sensitivity analysis, as if the trial was a parallel group trial (Dold 2016a). Including the cross‐over trial in the meta‐analysis of RCTs resulted in a larger potential benefit of iodine fortification on urinary iodine concentration (SMD 0.74, 95% CI 0.45 to 1.03; seven trials, 2064 participants; I² = 86%; Analysis 3.4).
3.4. Analysis.
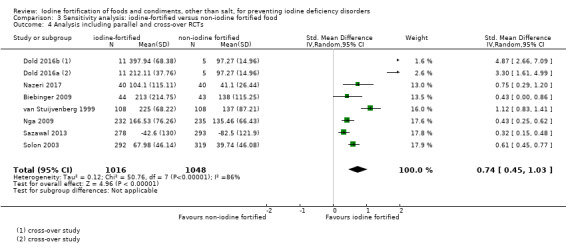
Comparison 3 Sensitivity analysis: iodine‐fortified versus non‐iodine fortified food, Outcome 4 Analysis including parallel and cross‐over RCTs.
Analysis excluding studies at high risk of bias
The three non‐RCTs included in the review were at high risk of bias. Among RCTs, when we excluded the studies that had an overall rating of high risk of bias (based on the presence of high or unclear risk of bias in allocation concealment, incomplete outcome data, and other sources of bias (Biebinger 2009; Nazeri 2017; Solon 2003; van Stuijvenberg 1999), we were left with two studies (Nga 2009; Sazawal 2013). The pooled estimate from these two studies was lower than the effect observed in the primary analysis (SMD 0.37, 95% CI 0.25 to 0.49; two trials, 1038 participants; I² = 0%; Analysis 3.5), but still significant.
3.5. Analysis.
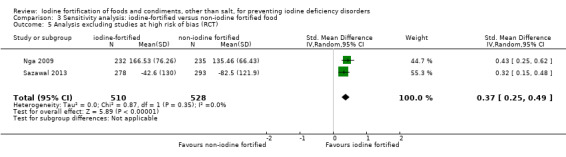
Comparison 3 Sensitivity analysis: iodine‐fortified versus non‐iodine fortified food, Outcome 5 Analysis excluding studies at high risk of bias (RCT).
Publication bias
We were not able to assess presence of small‐study effects or publication bias since the number of comparisons included in the meta‐analyses was less than 10.
Discussion
Summary of main results
Salt iodisation is the preferred strategy for iodine prophylaxis in many settings (WHO 2006), but is considered to be ineffective where salt is not the major condiment or where the presence of multiple small salt producers makes installation of fortification infrastructure difficult (Biebinger 2009). In these situations, alternative vehicles for iodine have been deemed necessary (WHO 2008). This review identified 11 studies that examined the effect of iodine fortification of foods, beverages, condiments, or seasonings other than salt, however, the available data for the prespecified outcomes was limited, and we were precluded from drawing any firm conclusions. We found very low‐quality evidence on the effects of iodine fortification on goitre prevalence and physical development, and low‐quality evidence on adverse effects (see Table 1).
The only outcome for which sufficient data were available was the secondary outcome of urinary iodine concentration. Data from RCTs produced moderate‐quality evidence that iodine fortification of foods moderately increased iodine nutrition status. This was consistent across all sensitivity analyses carried out based on study design, presence of alternative postintervention data points, and risk of bias.
However, it should be noted that we found substantial between‐study variability in relation to urinary iodine concentration, as measured by spot urine samples. We explored possible sources of heterogeneity through five subgroup analyses: age group, trial duration, daily iodine dose, percent with iodine deficiency at baseline, and type of fortification. We did not find any differential effect of iodine fortification on urinary iodine concentration. Some subgroups displayed less within‐subgroup heterogeneity, but this did not fully explain the between‐study variability found in the main analysis. Our subgroup analyses were not able to control for the heterogeneity observed, which is likely to be explained by factors not accounted for in this review. Thus, the results should be interpreted in light of such heterogeneity.
Overall completeness and applicability of evidence
The overall completeness and applicability of evidence related to the effect of iodine fortification of foods other than salt are limited by two main factors. First, there was an absence of, or insufficient data for all health outcomes, apart from urinary iodine concentration. Second, data were only available for children, women of reproductive age, and infants. As a consequence, our results are not complete enough to address the question initially posed, and we are uncertain as to what extent our findings apply to other health outcomes, and to other population groups, including the general population.
Nevertheless, the studies included in this review were implemented in different countries, covering five of the six WHO regions. The only region for which data was not available was the WHO region for the Americas, which according to the most recent data on global iodine deficiency status, is the region with the lowest rate of insufficient iodine intake (Li 2012). The region with the most number of studies from our review, Southeast Asia, has the highest rate of insufficient iodine intake in both school children and the general population (Li 2012). Two studies were from each of the Eastern Mediterrenean, European, and Western Pacific regions, and one was from the African region. This displays the wide scope of our review, and suggests that the evidence drawn, although limited to certain outcomes and population groups, might be applicable to a range of settings.
A key strength of this review is the inclusion of any food, beverage, condiment, or seasoning fortified with iodine alone or in combination with other micronutrients. The approach we took to include studies where iodine was cofortified with other micronutrients was inclusive, yet we made certain that the results generated from our analyses were not due to the presence of other micronutrients, by applying a stricter criteria for this type of studies. By doing this, we believe that the applicability of evidence drawn from this review has been enhanced, given that more studies implemented multiple micronutrient fortification.
Quality of the evidence
Using the Cochrane 'Risk of bias' tool, we were able to assess the risk of bias (methodological quality) of the included studies, and to use this as one of the sensitivity analyses to check the robustness of our findings (Higgins 2011). We assessed the three non‐randomised controlled trials (RCTs) at a high risk of bias. Among the RCTs, we found variations in methodological quality, with four studies assessed as having an overall high risk of bias. We assessed these studies at unclear or high risk of bias for allocation concealment, incomplete outcome data, or other sources of bias. On the other hand, three RCTs had low risk of bias for all seven domains, apart from selective outcome reporting, due to the absence of a protocol. It is notable that these three studies were among the studies with the biggest sample sizes, although we were not able to include data from one study in the meta‐analysis due to the format in which the data were reported. The cross‐over trial was the single study that was free of bias. Our sensitivity analyses excluding the four studies at high risk of bias yielded results similar to the primary analysis, suggesting that our findings were robust, notwithstanding the variations in quality captured across studies.
Using the GRADE framework, we rated the overall quality of the evidence as very low for goitre and physical development measures, due to limitations in study design (risk of bias; downgraded two levels) of the included trials and imprecise data (downgraded one level). We rated the overall quality of the evidence as low for adverse events due to indirectness (downgraded one level) and imprecise data (downgraded one level). There was moderate‐quality evidence from RCTs for urinary iodine concentration, due to limitations in study design (risk of bias; downgraded one level), while the quality of the evidence from non‐RCTs for the same outcome was very low due to serious study limitations (downgraded two levels) and imprecise results (downgraded one level; see Table 1).
Potential biases in the review process
Although we searched for articles from different sources, including the peer‐reviewed literature, grey literature, unpublished reports, and direct communication with experts and organisations working to address iodine and micronutrient deficiency, we cannot exclude the possibility that we missed relevant studies. We were not able to generate funnel plots to visually examine the presence of publication bias, due to the limited number of studies included in the analyses.
Our attempts to obtain additional information from authors or co‐authors of studies with missing data were unsuccessful. For this reason, we were not able to proceed with the intention‐to‐treat analysis that we initially planned (given that some studies did not report the number of participants randomised), so instead, we did an available case analysis (Higgins 2011). For each included study, we assessed the degree of missing data during our 'Risk of bias' assessment, which we took into account when we derived the overall bias rating by study.
We undertook extensive efforts to use all available data in the meta‐analyses. In particular, for urinary iodine concentration, since most studies reported the median and ranges (or interquartile ranges or percentiles), we converted the values into means and standard deviations (SD) using published equations (Bland 2015; Hozo 2005). These equations were developed through data simulation, and have been shown to produce estimates of SD that become larger with increasing sample size and skewness (Bland 2015). In our analyses, overestimation of the variability was of less concern within‐study, since the sample size in the intervention group and control group were comparable per study. However, overestimation of the variability might have caused a difference between studies with small and large sample sizes, which in turn could have inflated the heterogeneity measure observed in our results.
Agreements and disagreements with other studies or reviews
The effect of iodine fortification of foods, beverages, condiments, or seasonings other than salt on urinary iodine concentration found in this review is comparable to the effect of iodine fortification of salt (WHO 2014; Wu 2002), and iodine supplementation (Angermayr 2004), described in previous reviews with similar research methodology and population groups. These reviews reported significant increases in urinary iodine concentration following the intervention, compared to the comparison group. The studies included were generally of fairly poor quality. The WHO 2014 study rated the overall quality of the evidence for this outcome measure as low to moderate quality, given all data were from non‐randomised trials (cohort and multiple cross‐sectional studies) but with large effect sizes. Similar to our results, subgroup analyses did not show a difference in the effect of the intervention on urinary iodine concentration by age group, dose, or duration of exposure.
The same three reviews presented a trend towards reduction in goitre rate or prevalence, which was not shown in our review. The overall quality of evidence for this outcome measure was also low to moderate quality in the WHO 2014 study, for the same reasons stated above. The Angermayr 2004 study found no significant differences in physical development between intervention groups (apart from one study), similar to what we observed. This study recorded a small proportion of children who experienced minor and transient adverse effects from iodine supplementation. The WHO 2014 study found very low‐ to low‐quality evidence for adverse effects of iodised salt, due to limited studies. Recorded adverse events included elevated positive anti‐thyroid microsomal antibody, anti‐thyroglobulin antibody, and increased risk of elevated urinary iodine excretion (WHO 2014), and iodine‐induced hyperthyroidism (Wu 2002).
The systematic review and corresponding meta‐analysis to assess the effects and safety of consuming iodised salt to prevent iodine deficiency disorders is by far the largest compilation on the effect of iodine fortification, with some 89 studies included, from 26 countries, spanning more than eight decades (WHO 2014). The endorsement of fortified salt is considered the rationale for the much larger body of evidence.
Authors' conclusions
Implications for practice.
The evidence on the effect of iodine fortification of foods, beverages, condiments, or seasonings other than salt on goitre and physical development is uncertain, given that the evidence for these outcomes was based on only one study, which we judged to be of very low‐quality. In addition, the evidence on adverse effects is limited, since only one small study considered this outcome. However, our findings suggest that the intervention likely increases urinary iodine concentration. Additional data on the effects of iodine fortification of foods on these, and other important outcomes, as well as its efficacy and safety, would be preferred prior to any widespread implementation of this approach.
Implications for research.
There is a need for well‐designed, randomised controlled trials, adequately powered studies examining the effects of iodine fortification of candidate foods on important health outcomes (not limited to goitre, physical development, and urinary iodine concentration) in different population groups. These studies should be large and have long‐term follow‐up to examine whether benefits from iodine fortification of foods are sustainable or not. These studies should examine the amount of iodine required for different underlying conditions, and should measure adverse effects. Studies that examine the effects of fortifying foods compared to fortifying salt, or against a background of a national salt iodisation program, are also required.
Acknowledgements
We would like to thank the Cochrane Public Health Group for their support in the preparation of this review. We also wish to thank Bruce Neal and Mary Anne Land for their work on the published protocol and their contribution on the initial version of the manuscript.
Appendices
Appendix 1. Search strategy
International databases
Cochrane Public Health Group Register
(iodine or iod*) AND (fortif* or enrich* or boost* or enhanc* or increas* or improv* or add* or supplement*)
CENTRAL
#1 (iodine or iod*).mp
#2 (fortif* or enrich* or boost* or enhanc* or increas* or improv* or add* or supplement*).mp
#3 (food* or diet*).mp
#4 1 and 2 and 3
MEDLINE and MEDLINE (R) In‐Process
1. Iodine/
2. iod*.ti,ab.
3. 1 or 2
4. Food, Fortified/
5. ((fortif* or enrich* or boost* or enhanc* or increas* or improv* or add*) adj3 food*).tw.
6. ((fortif* or enrich* or boost* or enhanc* or increas* or improv* or add*) adj3 diet).tw.
7. 4 or 5 or 6
8. 3 and 7
Embase
1 exp iodine/
2 iod*.ti,ab.
3 1 or 2
4 ((fortif* or enrich* or boost* or increase* or improv* or add*) adj3 food*).ti,ab.
5 ((fortif* or enrich* or boost* or increase* or improv* or add*) adj3 diet*).ti,ab.
6 exp diet supplementation/
7 4 or 5 or 6
8 limit 3 to embase status
9 limit 7 to embase status
10 8 and 9
Web of Science
TS=(iodine OR iod*) AND TS=(( fortif* OR enrich* OR boost* OR enhanc* OR increas* OR improv* OR add* OR supplement*) NEAR/3 (food* OR diet*))
CINAHL
(iodine OR iod*) AND (fortif* OR enrich* OR boost* OR enhanc* OR increas* OR improv* OR add* OR supplement*) AND (food* OR diet*)
POPLINE
Iodine AND (fortif* OR enrich*)
AGRICOLA
Keyword Anywhere(iodine) AND Keyword Anywhere(fortification)
OpenGrey
(iodine OR iod*) AND(( fortif* OR enrich* OR boost* OR enhanc* OR increas* OR improv* OR add* OR supplement*) NEAR/3 (food* OR diet*))
Bibliomap
1 Freetext: “iodine” or “iod*”
2 Freetext: “fortif*” or “enrich*”
3 1 AND 2
TRoPHI
1 Freetext (All but Authors): “iodine” or “iod*”
2 Freetext (All but Authors): “fortif*” or “enrich*”
3 1 AND 2
AGRIS
Search: 'iodine' and 'fortification'
BIOSIS
(same as Web of Science search)
Food Science and Technology Abstracts
(same as MEDLINE and MEDLINE (R) In‐Process search)
Reginal databases
IBECS
iodine* [Words] and "fortif*" OR "enrich*" [Words]
Global Index Medicus
(tw:(iodin*)) AND (tw:(fortif*)) OR (tw:(enrich*))
WHOLIS
Kw,wrdl: iodine and kw,wrdl: fortification
IndMED
iodine AND fortify or fortified enrich or enriched
Native Health Research Database
KEYWORDS for: (iodine) AND (fortified or fortify or enrich or enriched)
SciELO
(same as Web of Science search)
LILACS, PAHO, WPRO, IMSEAR
(same as Global Index Medicus search)
Data and analyses
Comparison 1. Iodine fortified versus non‐iodine fortified food.
| Outcome or subgroup title | No. of studies | No. of participants | Statistical method | Effect size |
|---|---|---|---|---|
| 1 Goitre prevalence (non‐RCT) | 2 | 83 | Odds Ratio (M‐H, Random, 95% CI) | 1.60 [0.60, 4.31] |
| 2 Physical development measures (non‐RCT) | 2 | Mean Difference (IV, Random, 95% CI) | Subtotals only | |
| 2.1 Weight | 2 | 83 | Mean Difference (IV, Random, 95% CI) | 0.23 [‐6.30, 6.77] |
| 2.2 Height | 2 | 83 | Mean Difference (IV, Random, 95% CI) | ‐0.66 [‐4.64, 3.33] |
| 2.3 Weight‐for‐age | 2 | 83 | Mean Difference (IV, Random, 95% CI) | 0.05 [‐0.59, 0.69] |
| 2.4 Height‐for‐age | 2 | 83 | Mean Difference (IV, Random, 95% CI) | ‐0.30 [‐0.75, 0.15] |
| 2.5 Weight‐for‐height | 2 | 83 | Mean Difference (IV, Random, 95% CI) | ‐0.21 [‐0.51, 0.10] |
| 3 Urinary iodine concentration (RCT) | 6 | 2032 | Std. Mean Difference (IV, Random, 95% CI) | 0.59 [0.37, 0.81] |
| 4 Urinary iodine concentration (non‐RCT) | 5 | 262 | Std. Mean Difference (IV, Random, 95% CI) | 0.25 [‐0.16, 0.66] |
Comparison 2. Subgroup analysis: iodine‐fortified versus non‐iodine fortified food.
| Outcome or subgroup title | No. of studies | No. of participants | Statistical method | Effect size |
|---|---|---|---|---|
| 1 Urinary iodine concentration by age group (RCT) | 6 | 2032 | Std. Mean Difference (IV, Random, 95% CI) | 0.59 [0.37, 0.81] |
| 1.1 Age < 18 years old | 4 | 1865 | Std. Mean Difference (IV, Random, 95% CI) | 0.60 [0.33, 0.87] |
| 1.2 Age ≥ 18 years old | 2 | 167 | Std. Mean Difference (IV, Random, 95% CI) | 0.58 [0.27, 0.89] |
| 2 Urinary iodine concentration by trial duration (RCT) | 6 | 2032 | Std. Mean Difference (IV, Random, 95% CI) | 0.59 [0.37, 0.81] |
| 2.1 < 20 weeks | 3 | 1158 | Std. Mean Difference (IV, Random, 95% CI) | 0.55 [0.40, 0.70] |
| 2.2 ≥ 20 weeks | 3 | 874 | Std. Mean Difference (IV, Random, 95% CI) | 0.62 [0.08, 1.16] |
| 3 Urinary iodine concentration by daily iodine dose (RCT) | 6 | 2032 | Std. Mean Difference (IV, Random, 95% CI) | 0.59 [0.37, 0.81] |
| 3.1 < 120 µg/day | 3 | 1649 | Std. Mean Difference (IV, Random, 95% CI) | 0.46 [0.28, 0.63] |
| 3.2 ≥ 120 µg/day | 3 | 383 | Std. Mean Difference (IV, Random, 95% CI) | 0.79 [0.36, 1.21] |
| 4 Urinary iodine concentration by percent with iodine deficiency at baseline (RCT) | 6 | 2032 | Std. Mean Difference (IV, Random, 95% CI) | 0.59 [0.37, 0.81] |
| 4.1 < 50% | 2 | 1038 | Std. Mean Difference (IV, Random, 95% CI) | 0.37 [0.25, 0.49] |
| 4.2 ≥ 50% | 3 | 907 | Std. Mean Difference (IV, Random, 95% CI) | 0.82 [0.47, 1.17] |
| 4.3 unknown | 1 | 87 | Std. Mean Difference (IV, Random, 95% CI) | 0.43 [0.00, 0.86] |
| 5 Urinary iodine concentration by type of fortification (RCT) | 6 | 2032 | Std. Mean Difference (IV, Random, 95% CI) | 0.59 [0.37, 0.81] |
| 5.1 Iodine alone (Comparison 1 and 2) | 1 | 80 | Std. Mean Difference (IV, Random, 95% CI) | 0.75 [0.29, 1.20] |
| 5.2 Iodine plus other micronutrients (Comparison 5) | 5 | 1952 | Std. Mean Difference (IV, Random, 95% CI) | 0.57 [0.33, 0.82] |
Comparison 3. Sensitivity analysis: iodine‐fortified versus non‐iodine fortified food.
| Outcome or subgroup title | No. of studies | No. of participants | Statistical method | Effect size |
|---|---|---|---|---|
| 1 Analysis using alternative post‐intervention points (RCT) | 6 | 2032 | Std. Mean Difference (IV, Random, 95% CI) | 0.73 [0.36, 1.09] |
| 2 Analysis using alternative post‐intervention points (non‐RCT) | 5 | 262 | Std. Mean Difference (IV, Random, 95% CI) | 0.00 [‐0.47, 0.47] |
| 3 Analysis using different ICC for clustered studies (non‐RCT) | 5 | 144 | Std. Mean Difference (IV, Random, 95% CI) | 0.30 [‐0.09, 0.70] |
| 4 Analysis including parallel and cross‐over RCTs | 8 | 2064 | Std. Mean Difference (IV, Random, 95% CI) | 0.74 [0.45, 1.03] |
| 5 Analysis excluding studies at high risk of bias (RCT) | 2 | 1038 | Std. Mean Difference (IV, Random, 95% CI) | 0.37 [0.25, 0.49] |
Characteristics of studies
Characteristics of included studies [ordered by study ID]
Biebinger 2009.
| Methods | Trial design: randomised double‐blind controlled trial | |
| Participants | 279 women, aged 18 to 35 years, with low body iron stores (serum ferritin concentration < 25 µg/L), from two colleges in Kuwaiti City, State of Kuwait Mean age and standard deviation (SD), years: 20.1 (3.2) Percent female: 100% |
|
| Interventions | Participants were randomly assigned to one of three groups:
Fortified and non‐fortified wheat flour biscuits were consumed: 1 x 25 g x 5 days per week. Compliance: consumption of biscuits was not controlled Duration of intervention: 22 weeks (December 2006 to May 2007) |
|
| Outcomes | Urinary iodine concentration (µg/L) Notes on outcome:
|
|
| Notes | Iodine deficiency: not reported Adverse effects: not reported Cost of intervention: not reported Power and sample size calculation: not reported Sociodemographic data: not reported Socioeconomic status: not reported Source of funding: Kuwaiti Flour Mills and Bakeries Company (Kuwait City, Kuwait), the International Atomic Energy Agency (Vienna, Austria), ETH Zurich (Switzerland), Medicor Foundation (Liechtenstein) and the Kuwait Institute for Scientific Research (KISR) (Kuwait City, Kuwait) |
|
| Risk of bias | ||
| Bias | Authors' judgement | Support for judgement |
| Random sequence generation (selection bias) | Unclear risk | Quote: "Subjects meeting the inclusion criteria were randomly assigned to three groups..." Comment: not enough information to assess adequacy of sequence generation. |
| Allocation concealment (selection bias) | Unclear risk | No information provided about allocation concealment. |
| Blinding of participants and personnel (performance bias) All outcomes | Low risk | Quote: "double‐blind.." Comment: not enough information on who's blinded, but probably done |
| Blinding of outcome assessment (detection bias) All outcomes | Low risk | Quote: "double‐blind" Comment: not enough information on who's blinded, but outcome assessed (urinary iodine concentration) is an objective measure. |
| Incomplete outcome data (attrition bias) All outcomes | Low risk | Efficacy of iodine fortification was only assessed on a subset of participants (N = 129 agreed to participate), and there were no missing outcome data reported on this subset. 65% of screened subjects completed the iron fortification study (main study with bigger sample) and the main reasons for dropout were: time constraints, changing residence, illness and pregnancy. There were no significant differences in baseline characteristics between participants who completed and dropped out of the study. |
| Selective reporting (reporting bias) | Unclear risk | Protocol not available to permit judgment if all prespecified outcomes had been reported. |
| Other bias | Low risk | The study appears to be free of other potential sources of bias. |
Danilenko 2015.
| Methods | Trial design: cluster non‐randomised controlled trial | |
| Participants | 181 primary school children, aged 8 to 10 years, from the southern region of the Republic of Bashkortostan, Russia Mean age and SD: not reported Percent female: not reported |
|
| Interventions | Participants were assigned to one of two groups:
Fortified and non‐fortified milk were consumed: 1 x 200 mL x 1 day per week Compliance: not reported Duration of intervention: 36 weeks (month and year not specified, but the program was implemented from 2011 to 2014) |
|
| Outcomes | Urinary iodine concentration (µg/L) Notes on outcome:
|
|
| Notes | Iodine deficiency: the proportion of children with urinary iodine concentration < 100 µg/L was 57% in urban areas 92% in rural areas. Adverse effects: not reported Cost of intervention: not reported Power and sample size calculation: not reported Sociodemographic data: not reported Socioeconomic status: not reported Source of funding: Academy of Sciences of the Republic of Bashkortostan |
|
| Risk of bias | ||
| Bias | Authors' judgement | Support for judgement |
| Random sequence generation (selection bias) | High risk | Not RCT |
| Allocation concealment (selection bias) | High risk | Not RCT |
| Blinding of participants and personnel (performance bias) All outcomes | Unclear risk | No information provided |
| Blinding of outcome assessment (detection bias) All outcomes | Low risk | No information provided, but the review authors believe that the outcome measure (urinary iodine concentration) is not likely to be influenced by lack of blinding. |
| Incomplete outcome data (attrition bias) All outcomes | Unclear risk | Reasons for missing outcome data not reported |
| Selective reporting (reporting bias) | Unclear risk | Protocol not available to permit judgment if all prespecified outcomes had been reported |
| Other bias | Unclear risk | The effect of clustering was not accounted for in the analysis. The study authors described the difference between urban and rural areas at baseline, but did not provide information on baseline characteristics of the intervention and control groups to permit judgment of baseline imbalance. |
Dold 2016a.
| Methods | Trial design: randomised double‐blind cross‐over design | |
| Participants | 11 healthy exclusively formula‐fed infants, aged 2 to 4 months old at entry, from Zurich, Switzerland Mean age and SD, weeks: 13 (3.0) Percent female: 45% |
|
| Interventions | Participants were fed with three infant formula milk in random order:
The infant formula milks complied with the European Community directives, which states that all infant formula milks shall contain a minimum of 10 µg iodine/100 kcal and a maximum of 50 µg iodine/100 kcal. We treated Group 1 as the control group since the amount of iodine provided by this infant formula group was close to the minimum standard. Duration of intervention: 11 days for each infant formula milk group (6 run‐in days, 4‐day balance period, 1 run‐out day) |
|
| Outcomes | Iodine excretion (µg/day) Notes on outcome:
The authors reported that no adverse events were observed during the trial. |
|
| Notes | Iodine deficiency: not reported Adverse effects: no adverse effects observed during the trial. Cost of intervention: not reported Power and sample size calculation: reported that a sample size of 10 infants (30 observations) would have 80% power, given an effect size of 0.30, to detect a squared correlation coefficient of 0.365. Sociodemographic data: not reported Socioeconomic status: not reported Source of funding: infant formula milk was provided free of charge by the HOCHDORF Swiss Nutrition Ltd (Hochdorf, Switzerland); vitamins and minerals were provided free of charge by the DSM Nutritional Products Ltd. |
|
| Risk of bias | ||
| Bias | Authors' judgement | Support for judgement |
| Random sequence generation (selection bias) | Low risk | Quote: “Using spreadsheet software (Excel; Microsoft Office 2010), we randomly assigned the participants to 1 of 6 possible sequences of administration of the 3 IFMs (block size of 3).” |
| Allocation concealment (selection bias) | Low risk | Quote: "The 3 IFMs were packed in identical cans labelled with colour codes that did not indicate the type of formula or concentration of iodine." |
| Blinding of participants and personnel (performance bias) All outcomes | Low risk | Quote: "Subjects, investigators, and sponsors were masked to formula assignment." |
| Blinding of outcome assessment (detection bias) All outcomes | Low risk | Blinding unlikely to have been broken, and outcome assessed (urinary excretion) is an objective measure. |
| Incomplete outcome data (attrition bias) All outcomes | Low risk | All participants completed the study. One data point was removed as an outlier, based on visual inspection; unlikely to be related to true outcome. |
| Selective reporting (reporting bias) | Low risk | Protocol was available, and all prespecified outcomes were reported in complete and usable format. |
| Other bias | Low risk | The review authors believe that the cross‐over design was suitable. Carry‐over effect was addressed through 6 run‐in days, followed by 4‐day balance period, 1 run‐out day to avoid overlap. |
Dold 2016b.
| Methods | Trial design: randomised double‐blind cross‐over design | |
| Participants | 11 healthy exclusively formula‐fed infants, aged 2 to 4 months old at entry, from Zurich, Switzerland Mean age and SD, weeks: 13 (3.0) Percent female: 45% |
|
| Interventions | Participants were fed with three infant formula milk in random order:
The infant formula milks complied with the European Community directives, which states that all infant formula milks shall contain a minimum of 10 µg iodine/100 kcal and a maximum of 50 µg iodine/100 kcal. We treated Group 1 as the control group since the amount of iodine provided by this infant formula group was close to the minimum standard. Duration of intervention: 11 days for each infant formula milk group (6 run‐in days, 4‐day balance period, 1 run‐out day) |
|
| Outcomes | Iodine excretion (µg/day) Notes on outcome:
The authors reported that no adverse events were observed during the trial. |
|
| Notes | Iodine deficiency: not reported Adverse effects: no adverse effects observed during the trial. Cost of intervention: not reported Power and sample size calculation: reported that a sample size of 10 infants (30 observations) would have 80% power, given an effect size of 0.30, to detect a squared correlation coefficient of 0.365. Sociodemographic data: not reported Socioeconomic status: not reported Source of funding: infant formula milk was provided free of charge by the HOCHDORF Swiss Nutrition Ltd (Hochdorf, Switzerland); vitamins and minerals were provided free of charge by the DSM Nutritional Products Ltd. |
|
| Risk of bias | ||
| Bias | Authors' judgement | Support for judgement |
| Random sequence generation (selection bias) | Low risk | Quote: “Using spreadsheet software (Excel; Microsoft Office 2010), we randomly assigned the participants to 1 of 6 possible sequences of administration of the 3 IFMs (block size of 3).” |
| Allocation concealment (selection bias) | Low risk | Quote: "The 3 IFMs were packed in identical cans labelled with colour codes that did not indicate the type of formula or concentration of iodine." |
| Blinding of participants and personnel (performance bias) All outcomes | Low risk | Quote: "Subjects, investigators, and sponsors were masked to formula assignment." |
| Blinding of outcome assessment (detection bias) All outcomes | Low risk | Blinding unlikely to have been broken, and outcome assessed (urinary excretion) is an objective measure. |
| Incomplete outcome data (attrition bias) All outcomes | Low risk | All participants completed the study. One data point was removed as an outlier based on visual inspection; unlikely to be related to true outcome. |
| Selective reporting (reporting bias) | Low risk | Protocol was available, and all prespecified outcomes were reported in complete and usable format. |
| Other bias | Low risk | The review authors believe that the cross‐over design was suitable. Carry‐over effect was addressed through 6 run‐in days, followed by 4‐day balance period, 1 run‐out day to avoid overlap. |
Nazeri 2017.
| Methods | Trial design: randomised controlled trial | |
| Participants | 84 lactating mother‐infant pairs from four health care centres in the southern region of Tehran, Iran Mean age and SD of mothers, years: 28.2 (4.5) Mean age and SD of infants, days: 4.2 (0.7) Percent female, infants: 36% |
|
| Interventions | Participants were randomly assigned to one of two groups:
The intervention was only given to the mothers. Fortified milk was consumed: 1 x 200 mL x 7 days per week Compliance: 94.7% in the intervention group Duration of intervention: 4 weeks (month and year not reported) |
|
| Outcomes | Urinary iodine concentration of mothers (µg/L) Notes on outcome:
The authors also measured the infant's urinary iodine concentration, but we did not use these data, since the intervention was not directly applied to infants. |
|
| Notes | Iodine deficiency: the proportion of mothers with urinary iodine concentration < 100 µg/L at baseline was 64% in the intervention group and 54% in the control group. Adverse effects: not reported Cost of intervention: not reported Power and sample size calculation: reported that a sample size of 40 per group would have 90% power to detect a change in the median urinary iodine concentration of 35 µg/L, taking into account 30% attrition. Sociodemographic data: the two groups were comparable in terms of education years and occupation. Socioeconomic status: not reported Universal salt iodisation has been adopted in Iran. Source of funding: the Research Institute of Endocrine Sciences, Shahid Beheshti University of Medical Sciences |
|
| Risk of bias | ||
| Bias | Authors' judgement | Support for judgement |
| Random sequence generation (selection bias) | Low risk | Participants were assigned using a random number table. |
| Allocation concealment (selection bias) | High risk | Quote: “For an equal allocation, the direction for reading the table was predetermined as the right, and an arbitrary starting point was selected. Then, the researcher equated the odd and even numbers to the intervention and control groups, respectively.” Quote: "If mothers were lactose intolerant, they were assigned to the control group." |
| Blinding of participants and personnel (performance bias) All outcomes | High risk | Blinding of personnel and participants was not possible, given that the interventions were different (control group received advise while intervention group received the fortified product). |
| Blinding of outcome assessment (detection bias) All outcomes | Low risk | No information provided, but the review authors believe that the outcome measure (urinary iodine concentration) is not likely to be influenced by lack of blinding. |
| Incomplete outcome data (attrition bias) All outcomes | Low risk | Two mother‐infant pairs were lost to follow‐up in both groups. Reasons given were unlikely to be related to true outcome. |
| Selective reporting (reporting bias) | Unclear risk | The trial was registered. The results for the prespecified primary (infant urinary iodine concentration) and secondary outcomes (maternal breast milk and urinary iodine concentration) for multiple time points (at 3 to 5, 7, 10, and 14 days, and 1 month) were reported. However, the study authors did not provide sufficient information on why the results for one time point (at 2 months) were missing. Quote: "However, the limitations of the present study are that we could not assess the effects of iodine fortified milk during the entire six month exclusive breastfeeding period, for further confirmation of our results." |
| Other bias | Low risk | The study appeared to be free of other sources of bias. |
Nga 2009.
| Methods | Trial design: randomised double‐blind controlled trial | |
| Participants | 510 children, aged 6 to 8 years, from two schools in Bai Say and Xuan Truc communes, Hung Yen province, Vietnam Mean age and SD, years: 7.6 (0.9) Percent female: 52.4% |
|
| Interventions | Participants were randomly assigned to one of four groups:
Fortified and non‐fortified biscuits were consumed: 1 x 30 g x 5 days per week. Compliance: a total of 92.1% of children ate all of the intended servings Duration of intervention: 16 weeks (January 2007 to June 2007) |
|
| Outcomes | Urinary iodine concentration (µg/L) Notes on outcome:
|
|
| Notes | Iodine deficiency: prevalence of low urinary iodine excretion (<100 µg/L) was 44%. Adverse effects: not reported Cost of intervention: cost of biscuit was < 0.08 USD per serving Power and sample size calculation: reported that a sample size of 123 per group would have 90% power to detect a difference in haemoglobin concentration of 4 g/L, with 15% allowance for dropouts; secondary outcomes, such as changes in zinc, iodine, and ferritin concentrations all needed smaller sample sizes. Sociodemographic data: typical of the rural northeast area, Vietnam; mother's occupation ‐ percent farmer, 96%; mother's education ‐ percent secondary level, 87%. Socioeconomic status: percent poor, 29% Nationwide iodisation of salt has been adopted in Vietnam. Source of funding: not reported |
|
| Risk of bias | ||
| Bias | Authors' judgement | Support for judgement |
| Random sequence generation (selection bias) | Low risk | Quote: "Pupils were allocated to 1 of 4 intervention groups based on a computer‐generated list..." |
| Allocation concealment (selection bias) | Low risk | The group codes were kept by manufacturers and by a member of the institute staff not directly involved in the study. Allocation was done by one of the researchers not involved in the field work. |
| Blinding of participants and personnel (performance bias) All outcomes | Low risk | The teachers, field research assistants, or any researchers were not aware of the group codes during field implementation. Quote: "Each pupil wore a coloured name card that matched the coloured codes on the package..." |
| Blinding of outcome assessment (detection bias) All outcomes | Low risk | The teachers, field research assistants, or any researchers were not aware of the group codes during field implementation. Outcome assessed (urinary iodine concentration) is an objective measure. |
| Incomplete outcome data (attrition bias) All outcomes | Low risk | Missing outcome data balanced across groups, with similar reasons for missing data. |
| Selective reporting (reporting bias) | Unclear risk | Protocol not available to permit judgment if all prespecified outcomes had been reported. |
| Other bias | Low risk | No other sources of bias identified |
Pongpaew 1998a.
| Methods | Trial design: cluster non‐randomised controlled trial | |
| Participants | 263 school children, aged 6 to 12 years, from four primary schools from two districts of Khon Kaen Province, Northeast Thailand Mean age, years: 9.4 (SD not reported) Percent female: not reported |
|
| Interventions | Schools were randomly assigned to one of four groups:
Estimated consumption of fish sauce: 15 to 20 mL/day, which is equal to iodine intake of about 120 to 160 µg/day Estimated consumption of drinking water: 1000 mL/day, which is equal to iodine intake of about 200 µg/day Compliance: not reported Duration of intervention: 48 weeks (month and year not reported) |
|
| Outcomes | Goitre (%) Notes on outcome:
Urinary iodine concentration (µg/dL) Notes on outcome:
Physical development measures: weight (kg), height (cm), weight‐for‐age, height‐for‐age, weight‐for‐height Notes on outcome:
|
|
| Notes | Iodine deficiency: the proportion of children with urinary iodine concentration < 100 µg/L was 35% in Group 1, 42% in Group 2, and 39% in Group 3. Adverse effects: not reported Cost of intervention: not reported Power and sample size calculation: not reported Socio‐demographic data: not reported Socio‐economic status: not reported Universal salt iodisation has been adopted in Thailand. Source of funding: National Research Council of Thailand and Deutsche Gesellschaft fuer Technische Zusammenarbeit |
|
| Risk of bias | ||
| Bias | Authors' judgement | Support for judgement |
| Random sequence generation (selection bias) | High risk | Not RCT |
| Allocation concealment (selection bias) | High risk | Not RCT |
| Blinding of participants and personnel (performance bias) All outcomes | High risk | Blinding of personnel was not possible, since the interventions provided to the groups were different (one group received no intervention, one received fortified fish sauce, and one received fortified drinking water). |
| Blinding of outcome assessment (detection bias) All outcomes | Unclear risk | No information provided about blinding of outcome assessors Three outcomes: Goitre ‐ unclear risk: assessed by palpation of the thyroid gland by experienced physicians Urinary iodine concentration ‐ low risk: outcome measure is objective Physical development measures ‐ unclear risk: height and weight were measured using scales; weight‐for‐age, height‐for‐age, and weight‐for height scores were computed |
| Incomplete outcome data (attrition bias) All outcomes | Unclear risk | No information provided about missing outcome data |
| Selective reporting (reporting bias) | Unclear risk | Protocol not available to permit judgment if all prespecified outcomes had been reported. |
| Other bias | Unclear risk | The effect of clustering was not accounted for in the analysis. Quote: "The decrease in the proportion of children with low urinary iodine excretion also in the control school might be due to the fact that the village health volunteer where the control school is found, intensified his efforts in getting the villagers there to use iodide salt..." |
Pongpaew 1998b.
| Methods | Trial design: cluster non‐randomised controlled trial | |
| Participants | 263 school children, aged 6 to 12 years, from four primary schools from two districts of Khon Kaen Province, Northeast Thailand Mean age, years: 9.4 (SD not reported) Percent female: not reported |
|
| Interventions | Schools were randomly assigned to one of four groups:
Estimated consumption of fish sauce: 15 to 20 mL/day, which is equal to iodine intake of about to 160 µg/day. Estimated consumption of drinking water: 1000 mL/day, which is equal to iodine intake of about 200 µg/day. Compliance: not reported Duration of intervention: 48 weeks (month and year not reported) |
|
| Outcomes | Goitre (%) Notes on outcome:
Urinary iodine concentration (µg/dL) Notes on outcome:
Physical development measures: weight (kg), height (cm), weight‐for‐age, height‐for‐age, weight‐for‐height Notes on outcome:
|
|
| Notes | Iodine deficiency: the proportion of children with urinary iodine concentration <100 µg/L was 35% in Group 1, 42% in Group 2, and 39% in Group 3. Adverse effects: not reported Cost of intervention: not reported Power and sample size calculation: not reported Sociodemographic data: not reported Socioeconomic status: not reported Universal salt iodisation has been adopted in Thailand. Source of funding: National Research Council of Thailand and Deutsche Gesellschaft fuer Technische Zusammenarbeit |
|
| Risk of bias | ||
| Bias | Authors' judgement | Support for judgement |
| Random sequence generation (selection bias) | High risk | Not RCT |
| Allocation concealment (selection bias) | High risk | Not RCT |
| Blinding of participants and personnel (performance bias) All outcomes | High risk | Blinding of personnel was not possible, since the interventions provided to the groups were different (one group received no intervention, one received fortified fish sauce, and one received fortified drinking water). |
| Blinding of outcome assessment (detection bias) All outcomes | Unclear risk | No information provided about blinding of outcome assessors Three outcomes: Goitre ‐ unclear risk: assessed by palpation of the thyroid gland by experienced physicians Urinary iodine concentration ‐ low risk: outcome measure is objective. Physical development measures ‐ unclear risk: height and weight were measured using scales; weight‐for‐age, height‐for‐age, and weight‐for height scores were computed. |
| Incomplete outcome data (attrition bias) All outcomes | Unclear risk | No information provided about missing outcome data. |
| Selective reporting (reporting bias) | Unclear risk | Protocol not available to permit judgment if all prespecified outcomes had been reported. |
| Other bias | Unclear risk | The effect of clustering was not accounted for in the analysis. Quote: "The decrease in the proportion of children with low urinary iodine excretion also in the control school might be due to the fact that the village health volunteer where the control school is found, intensified his efforts in getting the villagers there to use iodide salt..." |
Saowakhontha 1994a.
| Methods | Trial design: cluster non‐randomised controlled trial | |
| Participants | 285 women, aged 15 to 45 years, from four villages, namely, Ban Wang Pa Dum, Ban Pa Klauy, Ban Non Chart, Ban Non Sa‐aad, of the Khon Kaen province, Northeast Thailand. Mean age and SD, years: not reported Percent female: 100% |
|
| Interventions | Villages were randomly assigned to one of four groups:
Estimated consumption of fish sauce: 15 to 20 mL/day, which is equal to iodine intake of about 120 to 160 µg/day. Estimated consumption of drinking water: 1000 mL/day, which is equal to iodine intake of about 200 µg/day. Compliance: not reported Duration of intervention: 24 weeks (month and year not reported) |
|
| Outcomes | Urinary iodine concentration (µmol/g creatinine) Notes on outcome:
|
|
| Notes | Iodine deficiency: prevalence of goitre at baseline was 50.6%; prevalence of low urinary iodine concentration (<100 µg/L) was 64%. Adverse effects: not reported Power and sample size calculation: not reported Cost of intervention: not reported Power and sample size calculation: not reported Sociodemographic data: not reported Socioeconomic status: not reported Universal salt iodisation has been adopted in Thailand. Source of funding: Deutsche Gesellschaft fuer Technische Zusammenarbeit |
|
| Risk of bias | ||
| Bias | Authors' judgement | Support for judgement |
| Random sequence generation (selection bias) | High risk | Not RCT |
| Allocation concealment (selection bias) | High risk | Not RCT |
| Blinding of participants and personnel (performance bias) All outcomes | High risk | Blinding of personnel was not possible, since the interventions provided to the groups were different (one group received no intervention, one received fortified fish sauce, and one received fortified drinking water). |
| Blinding of outcome assessment (detection bias) All outcomes | Low risk | No information provided, but the review authors believe that the outcome measure (urinary iodine concentration) is not likely to be influenced by lack of blinding. |
| Incomplete outcome data (attrition bias) All outcomes | Unclear risk | No information provided about missing outcome data. |
| Selective reporting (reporting bias) | Unclear risk | Protocol not available to permit judgment if all prespecified outcomes had been reported. |
| Other bias | Unclear risk | The effect of clustering was not accounted for in the analysis. There appears to be an imbalance in terms of the prevalence of goitre between the villages (clusters) at baseline. |
Saowakhontha 1994b.
| Methods | Trial design: cluster non‐randomised controlled trial | |
| Participants | 285 women, aged 15 to 45 years, from four villages, namely, Ban Wang Pa Dum, Ban Pa Klauy, Ban Non Chart, Ban Non Sa‐aad, of the Khon Kaen province, Northeast Thailand. Mean age and SD, years: not reported Percent female: 100% |
|
| Interventions | Villages were randomly assigned to one of four groups:
Estimated consumption of fish sauce: 15 to 20 mL/day, which is equal to iodine intake of about 120 to 160 µg/day. Estimated consumption of drinking water: 1000 mL/day, which is equal to iodine intake of about 200 µg/day. Compliance: not reported Duration of intervention: 24 weeks (month and year not reported) |
|
| Outcomes | Urinary iodine concentration (µmol/g creatinine) Notes on outcome:
|
|
| Notes | Iodine deficiency: prevalence of goitre at baseline was 50.6%; prevalence of low urinary iodine concentration (< 100 µg/L) was 64%. Adverse effects: not reported Power and sample size calculation: not reported Cost of intervention: not reported Power and sample size calculation: not reported Sociodemographic data: not reported Socioeconomic status: not reported Universal salt iodisation has been adopted in Thailand. Source of funding: Deutsche Gesellschaft fuer Technische Zusammenarbeit |
|
| Risk of bias | ||
| Bias | Authors' judgement | Support for judgement |
| Random sequence generation (selection bias) | High risk | Not RCT |
| Allocation concealment (selection bias) | High risk | Not RCT |
| Blinding of participants and personnel (performance bias) All outcomes | High risk | Blinding of personnel was not possible, since the interventions provided to the groups were different (one group received no intervention, one received fortified fish sauce, and one received fortified drinking water) |
| Blinding of outcome assessment (detection bias) All outcomes | Low risk | No information provided, but the review authors believe that the outcome measure (urinary iodine concentration) is not likely to be influenced by lack of blinding. |
| Incomplete outcome data (attrition bias) All outcomes | Unclear risk | No information provided about missing outcome data. |
| Selective reporting (reporting bias) | Unclear risk | Protocol not available to permit judgment if all prespecified outcomes had been reported. |
| Other bias | Unclear risk | The effect of clustering was not accounted for in the analysis. There appears to be an imbalance in terms of the prevalence of goitre between the villages (clusters) at baseline. |
Sazawal 2013.
| Methods | Trial design: randomised double‐blind controlled trial | |
| Participants | 1010 children, aged 6 to 9 years, from four primary schools of Gabtali town of Bogra district in the Rajshahi Division, Northern Bangladesh Mean age and SD, years: 7.0 (0.5) Percent female: 52.4% |
|
| Interventions | Participants were randomly assigned to one of two groups:
Fortified and non‐fortified yoghourt was consumed 1 x 60 g x 5 days per week Compliance: no significant differences between treatment groups in terms of compliance (about 97%) Duration of intervention: 48 weeks (June 2008 to March 2010) |
|
| Outcomes | Urinary iodine concentration (µg/L) Notes on outcome:
The study reported differences in physical development measures (i.e. weight velocity, height velocity, weight‐for‐age z‐score, height‐for‐age z‐score, and body mass index z‐score) between treatment groups postintervention. However, we did not include them in this review since these outcomes are likely to be affected by other micronutrients given to the participants. |
|
| Notes | Iodine deficiency: the proportion of children with urinary iodine level < 100 μg/dL was 27.6% Adverse effects: not reported Cost of intervention: not reported Power and sample size calculation: reported that a sample size of 400 would have 90% power to detect a change in height by 2.56 cm, weight by 930 g, haemoglobin by 2.6 g/L, iron deficiency anaemia by 38%, and zinc deficiency by 37%; no calculation was provided for urinary iodine excretion. Sociodemographic data: the two groups were comparable in terms of mother's and father's education, and employment. Socioeconomic status: the two groups were comparable in terms of type of house, ownership, and father's income. National salt iodisation program in Bangladesh since 1989 Source of funding: GAIN (Global Alliance for Improved Nutrition) funded the study and Grameen Danone Foods Ltd. Bogra, Bangladesh supplied the yoghourt. The company did not have any role in study funding, design, data collection, analysis, decision to publish, or preparation of the manuscript. |
|
| Risk of bias | ||
| Bias | Authors' judgement | Support for judgement |
| Random sequence generation (selection bias) | Low risk | Quote: "Using in‐house computer software, a random sequence of group codes with a permuted block length of 6 was generated to randomly allocate.." |
| Allocation concealment (selection bias) | Low risk | Quote: "Group codes from 1 to 6 were used to identify the fortified and non‐fortified yoghourt." |
| Blinding of participants and personnel (performance bias) All outcomes | Low risk | Quote: "The codes of the groups were not known to the investigators, field team, teachers, children, or anyone involved in the study during the field implementation." |
| Blinding of outcome assessment (detection bias) All outcomes | Low risk | Blinding of participants and key study personnel unlikely to have been broken. Outcome assessed (urinary iodine concentration) is an objective measure. |
| Incomplete outcome data (attrition bias) All outcomes | Low risk | Dropout rate and reasons for dropout were similar between the study groups. Main reasons for dropout unlikely to be related to true outcome. |
| Selective reporting (reporting bias) | Unclear risk | Protocol not available to permit judgment if all prespecified outcomes had been reported. |
| Other bias | Low risk | No other sources of bias were identified. |
Solon 2003.
| Methods | Trial design: randomised double‐blind controlled trial | |
| Participants | 851 children, aged 6 to 11 years, from four elementary schools in Balete, province of Batangas, Philippines Mean age and SD, years: 9.9 (2.2) Percent female: 48% |
|
| Interventions | Participants were randomly assigned to one of four groups:
Fortified and non‐fortified beverages were consumed 2 x 200 mL (25 g sachet) x 5 days per week Compliance: no significant differences between treatment groups in terms of compliance Duration of intervention: 16 weeks (October 1998 to March 1999) |
|
| Outcomes | Urinary iodine concentration (µg/L) Notes on outcome:
The study reported changes in physical development measures (i.e. weight, height, weight‐for‐age z‐score, height‐for‐age z‐score, and weight‐for‐height z‐score), and changes in mental ability scores (i.e. cognitive score, non‐verbal ability score, and verbal ability score) postintervention, however, we did not include them in this review since these outcomes are likely to be affected by other micronutrients given to the participants. For instance, the authors of the study provided evidence in the introduction section that iron deficiency has been shown to affect both physical and cognitive development in children. |
|
| Notes | Iodine deficiency: the proportion of children with urinary iodine concentration of < 100 µg/L was 90%. Adverse effects: not reported Cost of intervention: not reported Power and sample size calculation: for urinary iodine excretion, reported that a sample size of 320 per group would have 80% power to detect a difference of 10 µg/L at α = 0.05. Sociodemographic data: not reported Socioeconomic status: not reported Source of funding: Nutrition Centre of the Philippines and Procter and Gamble Co. |
|
| Risk of bias | ||
| Bias | Authors' judgement | Support for judgement |
| Random sequence generation (selection bias) | Unclear risk | Quote: "Study participants were assigned, through randomisation at the individual level, to one of four different treatment groups." Comment: not enough information to assess adequacy of sequence generation |
| Allocation concealment (selection bias) | Unclear risk | No information provided about allocation concealment |
| Blinding of participants and personnel (performance bias) All outcomes | Low risk | Quote: "Both researchers and the study participants were blinded to the treatment assignment...". |
| Blinding of outcome assessment (detection bias) All outcomes | Low risk | Blinding of participants and key study personnel unlikely to have been broken. Outcome assessed (urinary iodine concentration) is an objective measure. |
| Incomplete outcome data (attrition bias) All outcomes | Unclear risk | No reasons for missing outcome data provided |
| Selective reporting (reporting bias) | Unclear risk | Protocol not available to permit judgment if all prespecified outcomes had been reported. |
| Other bias | Low risk | No other sources of bias identified. |
van Stuijvenberg 1999.
| Methods | Trial design: randomised controlled trial | |
| Participants | 252 children, aged 6 to 11 years, from one school in KwaZulu‐Natal, South Africa Mean age and SD, years: 8.6 (2.0) Percent female: 48% |
|
| Interventions | Participants were randomly assigned to one of two groups:
Fortified and non‐fortified biscuits were consumed 3 x 15 g x 5 days per week Fortified and non‐fortified cold drinks were consumed 1 x 150 mL x 5 days per week Compliance: 92.4% in the intervention and 93.4% in the control group Duration of intervention: 43 weeks over 12 months (May 1995 to June 1996) |
|
| Outcomes | Goitre (%) Notes on outcome:
Urinary iodine concentration (µg/L) Notes on outcome:
The study reported changes in physical development measures (i.e. weight, height‐for‐age z‐score, and weight‐for‐age z‐score), and changes in cognitive development measures (i.e. verbal fluency, digit copying, writing crosses, counting letters, cancelling letters, reading numbers, digit span forward task, digit span backward task, and counting backward) postintervention, however, we did not include them in this review since these outcomes are likely to be affected by other micronutrients given to the participants. |
|
| Notes | Iodine deficiency: the proportion of children with urinary iodine excretion < 100 µg/L was more than 95% in both groups. Adverse effects: not reported Cost of intervention: cost of fortifying biscuits and cold drinks was R4.40 (˜0.7 USD). Power and sample size calculation: reported that a sample size of 100 would have 80% power to detect an increase in haemoglobin by 3%, and serum ferritin by 20%; no calculation was provided for urinary iodine excretion. Sociodemographic data: not reported Socioeconomic status: "a community characterised by low socioeconomic status". Universal salt iodisation has been adopted in South Africa. Source of funding: not reported |
|
| Risk of bias | ||
| Bias | Authors' judgement | Support for judgement |
| Random sequence generation (selection bias) | High risk | Quote: "...the children in each class were then systematically randomly assigned, from alphabetic class lists, to two groups." |
| Allocation concealment (selection bias) | High risk | Alphabetic class list used Comment: The review authors believe that this is an unconcealed procedure. |
| Blinding of participants and personnel (performance bias) All outcomes | Low risk | Quote: "Only the project leader was aware of the group allocation (singe‐blind study)." The fortified and non‐fortified biscuits were identical in taste and appearance. Both groups were also given identical cold drinks (fortified and non‐fortified). Groups were seated on opposite sides of the classroom during distribution and consumption to avoid exchange of biscuits and cold drinks. |
| Blinding of outcome assessment (detection bias) All outcomes | Low risk | Quote: "Only the project leader was aware of the group allocation (singe‐blind study)." Goitre ‐ low risk: assessors for goitre were not involved in the study. Urinary iodine concentration ‐ low risk: outcome measure is objective. |
| Incomplete outcome data (attrition bias) All outcomes | Unclear risk | No information about the number of participants assessed for goitre post‐intervention to permit judgement if there were missing outcome data. |
| Selective reporting (reporting bias) | Unclear risk | Protocol not available to permit judgment if all prespecified outcomes had been reported. |
| Other bias | Low risk | No other sources of bias identified. |
Winichagoon 2006.
| Methods | Trial design: randomised controlled trial | |
| Participants | 569 children, aged 5.5 to 13.4 years, from 10 primary schools in Ubon Ratchathani Province, North East Thailand Mean age and SD, years: 9.2 (1.7) Percent female: 50.5% |
|
| Interventions | Participants were randomly assigned to one of two groups:
Seasoning powder was added to instant wheat noodle (3 days per week) or rice (2 days per week). Compliance: no important differences between treatment groups in terms of compliance; median amount of food eaten per intervention day was 0.75 (more than half). Duration of intervention: 31 weeks (August 2002 to March 2003) |
|
| Outcomes | Urinary iodine concentration (µg/L) Notes on outcome:
|
|
| Notes | Iodine deficiency: the proportion of children with urinary iodine concentration < 100 µg/L at baseline was 61% in Group 1 and 83% in Group 2 Adverse effects: not reported Cost of intervention: not reported Power and sample size calculations: reported that a sample size of 250 per group would have 80% power to detect a decrease of 10% in the prevalence of anaemia, accounting for possible attrition; no calculation was provided for urinary iodine excretion. Sociodemographic data: rural districts; occupation ‐ percent farmer, 89%; education level ‐ percent primary level, >80%. Socioeconomic status: the districts were of low socioeconomic status. Universal salt iodisation has been adopted in Thailand. Source of funding: the Micronutrient Initiative Fund, the University of Otago Research Fund, and the Institute of Nutrition, Mahidol University |
|
| Risk of bias | ||
| Bias | Authors' judgement | Support for judgement |
| Random sequence generation (selection bias) | Low risk | Random number generation using a statistical software |
| Allocation concealment (selection bias) | Low risk | Central allocation |
| Blinding of participants and personnel (performance bias) All outcomes | Low risk | Quote: "The investigators, food preparers, teachers, outcome assessors, and children were not made aware of the intervention assignment for the duration of the study..." |
| Blinding of outcome assessment (detection bias) All outcomes | Low risk | Blinding of outcome assessors present, and outcome assessed (urinary iodine concentration) is an objective measure. |
| Incomplete outcome data (attrition bias) All outcomes | Low risk | Missing data and reasons given were balanced across groups. |
| Selective reporting (reporting bias) | Unclear risk | Protocol not available to permit judgment if all prespecified outcomes had been reported. |
| Other bias | Low risk | No other sources of bias identified. |
Characteristics of excluded studies [ordered by study ID]
| Study | Reason for exclusion |
|---|---|
| Abuye 1995 | Intervention does not meet criteria for inclusion (point‐of‐use fortification); oral iodised oil supplementation |
| Alexy 2009 | Product development study; review of fortification practice of complementary food |
| Asonye 2001 | Product development study; review of the feasibility of fortifying cassava |
| Brantsaeter 2009 | Not relevant: assessment of 24‐h urinary iodine excretion as a possible biomarker for the intake of mild and dairy products when assessing the validity of a new food frequency questionnaire for pregnant women |
| Chavasit 1998 | Product development study; review of the feasibility of fortifying instant noodles |
| Chavasit 2003 | Product development study; review of the feasibility of fortifying pure fish sauce, mixed fish sauce, and salt brine for cooking |
| Eltom 1995 | No control arm |
| Foo 1996 | No control arm |
| Garber 1992 | Intervention did not meet criteria for inclusion (bio‐fortification); iodine enriched hen food to produce iodine enriched hen eggs |
| Garber 1993 | Intervention did not meet criteria for inclusion (bio‐fortification); iodine enriched hen food to produce iodine enriched hen eggs |
| Goyle 2011 | No control arm |
| Goyle 2012 | Eligible intervention (non‐fortified biscuits versus biscuits fortified with vitamin A, iron, folic acid, vitamin C and iodine; comparison 5) but outcomes assessed were likely to be influenced by cofortification of iodine with other micronutrients (i.e. effects of iodine on outcomes cannot be isolated). |
| Kallioinen 2017 | Intervention did not meet criteria for inclusion; iodine supplementation in pregnant women |
| Koryachkina 2015 | No control arm |
| Liu 2015 | Intervention did not meet criteria for inclusion (exposure rather than an intervention; water with varying levels of iodine based on location); not a prospective study |
| Phuka 2008 | Eligible intervention (fortified maize‐soy flour without iodine versus multiple‐fortified spread with iodine; comparison 5) but outcomes assessed were likely to be influenced by cofortification of iodine with other micronutrients (i.e. effects of iodine on outcomes cannot be isolated). |
| Pichard 1991 | Intervention did not meet criteria for inclusion; the controlled release of iodine into water used iodine salt |
| Stos 2015 | Intervention did not meet criteria for inclusion; iodine supplementation in pregnant women |
| Sukhinina 1997 | No control arm |
| Tazhibayev 2008 | Intervention did not meet criteria for inclusion; iodised salt |
| Thakwalakwa 2015 | Intervention did not meet criteria for inclusion; home fortification |
| Tulyathan 2009 | No control arm |
| Untoro 2006 | Intervention did not meet criteria for inclusion (point‐of‐use fortification); oral iodised oil supplementation |
| van Stuijvenberg 2001 | No control arm |
Differences between protocol and review
Background: we made changes to this section to make it more clear and concise, and to update references.
Objectives: we changed the wording of the objective to add clarity, from "fortifying staple foods other than salt with iodine alone (or with other vitamins and minerals too)" to "fortifying foods, beverages, condiments, or seasonings other than salt with iodine alone, or in conjunction with other micronutrients". We believe that the revised terminology did not change the objective of the review. The examples of staple foods anticipated to have been fortified (which include beverages, condiments, and seasonings) were listed in the protocol prior to this change.
Types of studies: in our protocol, we indicated that we would include RCTs with randomisation at either individual or cluster level, quasi‐RCTs, and prospective observational studies with a control group (Land 2013). We made minor changes to this section to make it more clear that we also considered cross‐over trials and non‐RCTs when we searched for eligible studies. We moved the statement about not pooling the results from RCTs with other study designs to the Data synthesis section.
Types of interventions: We changed the wording of the comparisons and provided examples for clarity. We also made important changes to this section. In our protocol, we indicated four types of comparisons and stated that we would exclude foods to which other micronutrients had been added (Land 2013). We set this to make sure that we could isolate the effects of iodine fortification on outcome measures. However, during the review process, it became apparent that most studies would compare 'fortification of foods with iodine plus other micronutrients' versus'the same food without iodine, but with different fortification levels of other micronutrients'. As a group, we decided to take an inclusive approach for studies where iodine was cofortified with other micronutrients. Thus, we added another comparison, but applied a stricter criteria for the outcome measures (as our way of isolating the effects of iodine fortification on outcome measures). We included comparisons involving fortification of food with iodine plus other micronutrients versus no intervention, or the same food with different levels of fortification if the outcome measures reported were only likely to be affected by iodine (i.e. goitre and urinary iodine concentration).
Types of outcome measures: we removed 'adverse effects' from mention in the secondary outcomes to avoid repetition. We moved the statement about timing of outcome assessment to the Measures of treatment effect section. We included the last assessment in the primary analysis, and included alternative postintervention points in the sensitivity analysis.
Electronic searches: where available, we added the inception dates of the databases.
Data extraction and management: we made minor changes to the text to add clarity, and listed the information extracted from the studies. In our protocol, we stated that data would be entered into RevMan 5 by two review authors and would be checked by a third review author. During actual data entry, one review author entered the data into RevMan 5, which was checked for accuracy by a second and a third review author. We believe that this process is as rigorous as the one initially planned. We also attempted to contact study authors and co‐authors to seek additional information, however, our attempts were unsuccessful.
Assessment of risk of bias in included studies: we made important changes to this section. In our protocol, we indicated that we would assess risk of bias in included studies using nine domains, based on the combined domains from the Cochrane and the EPOC 'Risk of bias' tool. However, during the review process, we recognised that the Cochrane 'Risk of bias' tool would be more appropriate, and easier to apply for the type of studies that were included in our review. Given this change, we also modified the criteria for determining the overall risk of bias by study, since the 'similarity of baseline outcome measurements' domain was no longer applicable. We also added details about scoring the risk of bias for each bias domain for studies with more than one outcome measure, and also added more details about how we rated the overall quality of the evidence using the GRADE framework.
Measures of treatment effect: we lengthened the section on continuous outcomes to include more information about the approaches for combining postintervention and change‐from‐baseline results, dealing with studies with multiple data points, converting SEs and CIs to SDs, and converting median and range (or interquartile range and percentiles) to mean and SDs. We removed the statement about preference for continuous data (if more than one type of data was provided), since we did not encounter this during the review process.
Unit of analysis issues: we added more details about how we calculated the design effect and effective sample size for clustered studies, and the ICC values that we used in the primary and sensitivity analyses. We also added a section about how we dealt with the cross‐over trial identified in the review.
Dealing with missing data: in our protocol, we stated that we would carry out an intention‐to‐treat analysis, however, this was not possible, due to lack of access to raw participant data. Hence, we conducted an available case analysis.
Assessment of reporting biases: we removed the statements about selective reporting from this section (as this was covered in the 'Risk of bias' section), and focused on publication bias.
Data synthesis: we included details about how we took into account the risk of bias of included studies in data synthesis.
Subgroup analysis and investigation of heterogeneity: we made changes to this section since the studies did not report the information needed for us to be able to conduct our prespecified subgroup analyses. Based on available information from the studies, we conducted several post‐hoc subgroup analyses to explore sources of heterogeneity. For 'age group' and 'iodine intake of the population', we changed the classification (from four groups to two groups) for applicability (considering the number of studies and data reported), and ease.
Sensitivity analysis: we added two sensitivity analyses, one on using alternative post‐intervention data points, and one on combining the results of the cross‐over trial with other RCTs.
Contributions of authors
JS assessed the papers at the title and abstract, and the full‐text stage, undertook data extraction, and risk of bias assessment, conducted the analyses, and drafted the review.
AC completed the initial and updated search to identify potential studies, assessed the papers at the title and abstract, and the full‐text stage, and contributed to the draft and final text of the review.
KT assessed the papers at the full‐text stage and contributed to the final text of the review.
BM completed the updated search, assessed the papers at the title and abstract, and the full‐text stage, undertook data extraction, and risk of bias assessment, and contributed to the final text of the review.
SD assessed the papers at the title and abstract stage, and contributed to the final text of the review.
LB provided statistical input, oversaw the data analysis, and contributed to the final text of the review.
JW coordinated the review, provided comments, and contributed to the final text of the review.
ML provided guidance and critical evaluation of the contents of the review.
All review authors reviewed and approved the final text of the manuscript.
Sources of support
Internal sources
The George Institute for Global Health, Australia.
Evidence and Programme Guidance, Department of Nutrition for Health and Development, World Health Organization, Switzerland.
External sources
-
World Health Organization, Switzerland.
The Department of Nutrition for Health and Development for the financial support for the commissioned review.
Declarations of interest
JW is the Director of the World Health Organization Collaborating Centre on Population Salt Reduction, and receives funding for her work from the National Health and Medical Research Council, the Victorian Health Promotion Foundation, and headquarters and various regional offices of the World Health Organization. From 2003 to 2006, she managed the UK government's Salt Reduction program while working for the Food Standards Agency. She is currently supported by a four‐year National Health and Medical Research Council Fellowship/National Heart Foundation fellowship for her work on salt reduction.
KT receives support from a National Health and Medical Research Council postgraduate scholarship, the Victorian Health Promotion Foundation (VicHealth), and the World Health Organization. She received financial support from the World Health Organization during the conduct of the study.
ML ‐ none known.
JS ‐ none known.
AC ‐ none known.
BM ‐ none known.
SD ‐ none known.
LB ‐ none known.
New
References
References to studies included in this review
Biebinger 2009 {published data only}
- Biebinger R, Zimmermann M, Al‐Hooti S, Al‐Hamed N, Al‐Salem E, Zafar T, et al. Efficacy of wheat‐based biscuits fortified with microcapsules containing ferrous sulfate and potassium iodate or a new hydrogen‐reduced elemental iron: a randomised, double‐blind, controlled trial in Kuwaiti women. British Journal of Nutrition 2009;102(9):1362‐9. [DOI] [PubMed] [Google Scholar]
Danilenko 2015 {published data only}
- Danilenko AL, Kamilov F, Mamtsev AN, Kozlov VN, Ponomarev EE. Effectiveness of the program "School Milk" for the prevention of iodine deficiency. Voprosy Pitaniia 2015;84(2):53‐8. [PubMed] [Google Scholar]
Dold 2016a {published data only}
- Dold S, Zimmermann MB, Baumgartner J, Davaz T, Galetti V, Braegger C, et al. A dose‐response crossover iodine balance study to determine iodine requirements in early infancy. American Journal of Clinical Nutrition 2016;104(3):620‐8. [DOI] [PubMed] [Google Scholar]
Dold 2016b {published data only}
- Dold S, Zimmermann MB, Baumgartner J, Davaz T, Galetti V, Braegger C, et al. A dose‐response crossover iodine balance study to determine iodine requirements in early infancy. American Journal of Clinical Nutrition 2016;104(3):620‐8. [DOI] [PubMed] [Google Scholar]
Nazeri 2017 {published data only}
- Azizi F. Evaluation of the effects of iodine fortified‐milk on lactating mothers’ and their infants’ iodine nutrition status. Iranian Registry of Clinical Trials (IRCT201305074794N9) 2013‐05‐20.
- Nazeri P, Mirmiran P, Tahmasebinejad Z, Hedayati M, Delshad H, Azizi F. The effects of iodine fortified milk on the iodine status of lactating mothers and infants in an area with a successful salt iodization program: A randomized controlled trial. Nutrients 2017;9(2):22. [DOI] [PMC free article] [PubMed] [Google Scholar]
Nga 2009 {published data only}
- Nga TT, Winichagoon P, Dijkhuizen MA, Khan NC, Wasantwisut E, Furr H, et al. Multi‐micronutrient‐fortified biscuits decreased prevalence of anemia and improved micronutrient status and effectiveness of deworming in rural Vietnamese school children. The Journal of Nutrition 2009;139(5):1013‐21. [DOI] [PubMed] [Google Scholar]
Pongpaew 1998a {published data only}
- Pongpaew P, Saowakontha S, Tungtrongchitr R, Mahaweerawat U, Schelp F. Iodine deficiency disorder – an old problem tackled again: a review of comprehensive operational study in the northeast of Thailand. Nutrition Research 2002;22:137‐44. [Google Scholar]
- Pongpaew P, Tungtrongchitr R, Phonrat B, Supawan V, Schelp FP, Intarakhao C, et al. Nutritional status of school children in an endemic area of iodine deficiency disorders (IDD) after one year of iodine supplementation. Southeast Asian Journal of Tropical Medicine and Public Health 1998;29(1):50‐7. [PubMed] [Google Scholar]
Pongpaew 1998b {published data only}
- Pongpaew P, Saowakontha S, Tungtrongchitr R, Mahaweerawat U, Schelp F. Iodine deficiency disorder – an old problem tackled again: a review of comprehensive operational study in the northeast of Thailand. Nutrition Research 2002;22:137‐44. [Google Scholar]
- Pongpaew P, Tungtrongchitr R, Phonrat B, Supawan V, Schelp FP, Intarakhao C, et al. Nutritional status of school children in an endemic area of iodine deficiency disorders (IDD) after one year of iodine supplementation. Southeast Asian Journal of Tropical Medicine and Public Health 1998;29(1):50‐7. [PubMed] [Google Scholar]
Saowakhontha 1994a {published data only}
- Pongpaew P, Saowakontha S, Tungtrongchitr R, Mahaweerawat U, Schelp F. Iodine deficiency disorder – an old problem tackled again: A review of comprehensive operational study in the northeast of Thailand. Nutrition Research 2002;22:137‐44. [Google Scholar]
- Saowakhontha S, Sanchaisuriya P, Pongpaew P, Tungtrongchitr R, Supawan V, Intarakhao C, et al. Compliance of population groups of iodine fortification in an endemic area of goiter in northeast Thailand. Journal of the Medical Association of Thailand 1994;77(9):449‐54. [PubMed] [Google Scholar]
Saowakhontha 1994b {published data only}
- Pongpaew P, Saowakontha S, Tungtrongchitr R, Mahaweerawat U, Schelp F. Iodine deficiency disorder – an old problem tackled again: a review of comprehensive operational study in the northeast of Thailand. Nutrition Research 2002;22:137‐44. [Google Scholar]
- Saowakhontha S, Sanchaisuriya P, Pongpaew P, Tungtrongchitr R, Supawan V, Intarakhao C, et al. Compliance of population groups of iodine fortification in an endemic area of goiter in northeast Thailand. Journal of the Medical Association of Thailand 1994;77(9):449‐54. [PubMed] [Google Scholar]
Sazawal 2013 {published data only}
- Sazawal S, Habib A, Dhingra U, Dutta A, Dhingra P, Sarkar A, et al. Impact of micronutrient fortification of yoghurt on micronutrient status markers and growth – a randomized double blind controlled trial among school children in Bangladesh. BMC Public Health 2013;13:514. [DOI] [PMC free article] [PubMed] [Google Scholar]
Solon 2003 {published data only}
- Solon F, Sarol J, Bernardo A, Solon J, Mehansho H, Sanchez‐Fermin L, et al. Effect of a multiple‐micronutrient‐fortified fruit powder beverage on the nutrition status, physical fitness, and cognitive performance of schoolchildren in the Philippines. Food and Nutrition Bulletin 2003;24:S129‐40. [DOI] [PubMed] [Google Scholar]
van Stuijvenberg 1999 {published data only}
- Stuijvenberg M, Kvalsvig J, Faber M, Kruger M, Kenoyer D. Effect of iron‐, iodine‐, and beta‐carotene‐fortified biscuits on the micronutrient status of primary school children: a randomized controlled trial. American Journal of Clinical Nutrition 1999;69(3):497‐503. [DOI] [PubMed] [Google Scholar]
Winichagoon 2006 {published data only}
- Manger M, McKenzie J, Winichagoon P, Gray A, Chavasit V, Pongcharoen T, et al. A micronutrient‐fortified seasoning powder reduces morbidity and improves short‐term cognitive function, but has no effect on anthropometric measures in primary school children in northeast Thailand: a randomized controlled trial. American Journal of Clinical Nutrition 2008;87(6):1715‐22. [DOI] [PubMed] [Google Scholar]
- Winichagoon P, McKenzie J, Chavasit V, Pongcharoen T, Gowachirapant S, Boonpraderm A, et al. A multimicronutrient‐fortified seasoning powder enhances the hemoglobin, zinc, and iodine status of primary school children in North East Thailand: a randomized controlled trial of efficacy. The Journal of Nutrition 2006;136(6):1617‐23. [DOI] [PubMed] [Google Scholar]
References to studies excluded from this review
Abuye 1995 {published data only}
- Abuye C, Hailemariam B, Tibeb HN, Urga K, Gebru H. The effect of varying doses of oral iodized oil in the prophylaxis of endemic goitre in elementary schools children. Ethiopian Medical Journal 1995;33(2):115‐23. [PubMed] [Google Scholar]
Alexy 2009 {published data only}
- Alexy U, Drossard C, Kersting M, Remer T. Iodine intake in the youngest: impact of commercial complementary food. European Journal of Clinical Nutrition 2009;63(11):1368‐70. [DOI] [PubMed] [Google Scholar]
Asonye 2001 {published data only}
- Asonye C. Fortification of common Nigerian food‐cassava meals. Food and Nutrition Bulletin 2001;22(4):423‐6. [Google Scholar]
Brantsaeter 2009 {published data only}
- Brantsaeter AL, Haugen M, Julshamn K, Alexander J, Meltzer HM. Evaluation of urinary iodine excretion as a biomarker for intake of milk and dairy products in pregnant women in the Norwegian Mother and Child Cohort Study (MoBa). European Journal of Clinical Nutrition 2009;63(3):347‐54. [DOI] [PubMed] [Google Scholar]
Chavasit 1998 {published data only}
- Chavasit V, Tontisirin K. Triple fortification of instant noodles in Thailand. Food and Nutrition Bulletin 1998;19(2):164‐7. [Google Scholar]
Chavasit 2003 {published data only}
- Chavasit V, Nopburabutr P, Kongkachuichai R. Combating iodine and iron deficiencies through the double fortification of fish sauce, mixed fish sauce, and salt brine. Food and Nutrition Bulletin 2003;24(2):200‐7. [DOI] [PubMed] [Google Scholar]
Eltom 1995 {published data only}
- Eltom M, Elnagar B, Sulieman EA, Karlsson FA, Thi HV, Bourdoux P, et al. The use of sugar as a vehicle for iodine fortification in endemic iodine deficiency. International Journal of Food Sciences and Nutrition 1995;46(3):281‐9. [DOI] [PubMed] [Google Scholar]
Foo 1996 {published data only}
- Foo LC, Zainam T, Nafikudin M, Letchuman GR. Salt: an ineffective vehicle for iodine delivery to young children in rural Sarawak. Annales d'Endocrinolgoe 1996;57:470‐5. [PubMed] [Google Scholar]
Garber 1992 {published data only}
- Garber DW, Henkin Y, Osterlund LC, Darnell BE, Segrest JP. Plasma lipoproteins in hyperlipidemic subjects eating iodine‐enriched eggs. Journal of the American College of Nutrition 1992;11(3):294‐303. [DOI] [PubMed] [Google Scholar]
Garber 1993 {published data only}
- Garber DW, Henkin Y, Osterlund LC, Woolley TW, Segrest JP. Thyroid function and other clinical chemistry parameters in subjects eating iodine‐enriched eggs. Food and Chemical Toxicology: an international journal published for the British Industrial Biological Research Association 1993;31(4):247‐51. [DOI] [PubMed] [Google Scholar]
Goyle 2011 {published data only}
- Goyle A, Prakash S. Efficacy of multi‐micronutrient fortified biscuits on urinary iodine levels of adolescent girls from Jaipur, India. Malaysian Journal of Nutrition 2011;17(2):143‐50. [PubMed] [Google Scholar]
Goyle 2012 {published data only}
- Goyle A. Effect of micronutrient fortified biscuit supplementation on the weight, height and BMI of adolescent girls. Colleqium Antropologicum 2012;36(2):573‐9. [PubMed] [Google Scholar]
Kallioinen 2017 {published data only}
- Kallioinen M, Ekstrom E‐C, Khan AI, Lindstrom E, Persson LA, Rahman A, et al. Prenatal early food and multiple micronutrient supplementation trial reduced infant mortality in Bangladesh, but did not influence morbidity. Acta Paediatrica 2017 December;106(12):1979‐86. [DOI] [PubMed] [Google Scholar]
Koryachkina 2015 {published data only}
- Koryachkina SY, Ladnova OL, Lublinsky SL, Kholodova EN. Efficiency of application of the enriched bakery products in children nutrition. Vopr Pitan 2015;84(3):77‐84. [PubMed] [Google Scholar]
Liu 2015 {published data only}
- Liu L, Wang D, Liu P, Meng F, Wen D, Jia Q, et al. The relationship between iodine nutrition and thyroid disease in lactating women with different iodine intakes. British Journal of Nutrition 2015;114:1487‐95. [DOI] [PubMed] [Google Scholar]
Phuka 2008 {published data only}
- Phuka JC, Maleta K, Thakwalakwa C, Cheung YB, Briend A, Manary MJ, et al. Complementary feeding with fortified spread and incidence of severe stunting in 6‐ to 18‐month‐old rural Malawians. Archives of Pediatrics and Adolescent Medicine 2008;162(7):619‐26. [DOI] [PMC free article] [PubMed] [Google Scholar]
Pichard 1991 {published data only}
- Pichard E, Fisch A, Sebbag R, Maiga B, Fongoro S, Ag Rhaly A, et al. Evolution of endemic goiter in Malian women and children after a year of enrichment of drinking water with iodine using diffusers made of silicone [Evolution du goitre endemique chez les femmes et les enfants maliens apres un an d'enrichissement de l'eau de boisson en iode par des diffuseurs en silicone]. Bulletin de la Societe de Pathologie Exotique 1991;84(5):783‐93. [PubMed] [Google Scholar]
Stos 2015 {published data only}
- Stos K, Oltarzewski, Malachowska A, Krygier B. Food supplements as an important source of iodine in the diets of pregnant women in Poland. Annals of Nutrition and Metabolism 2015;67:192‐3. [Google Scholar]
Sukhinina 1997 {published data only}
- Sukhinina SI, Seliatitskaia VG, Pal'chikova NA, Shorin I, Pozniakovskii VM, Bondarev GI. Effectiveness of using processed cheese enriched with iodine in the prevention of endemic goitre. Voprosy Pitaniia 1997;1:21‐3. [PubMed] [Google Scholar]
Tazhibayev 2008 {published data only}
- Tazhibayev S, Dolmatova O, Ganiyeva G, Khairov K, Ospanova F, Oyunchimeg D, et al. Evaluation of the potential effectiveness of wheat flour and salt fortification programs in five Central Asian countries and Mongolia, 2002‐2007. Food and Nutrition Bulletin 2008;29(4):255‐65. [DOI] [PubMed] [Google Scholar]
Thakwalakwa 2015 {published data only}
- Thakwalakwa C, Ashorn P, Phuka J, Cheung YB, Briend A, Maleta K. Impact of lipid‐based nutrient supplements and corn–soy blend on energy and nutrient intake among moderately underweight 8–18‐month‐old children participating in a clinical trial. Maternal and Child Nutrition 2015;11:144‐50. [DOI] [PMC free article] [PubMed] [Google Scholar]
Tulyathan 2009 {published data only}
- Tulyathan V, Prunglumpu S. Iodine‐fortified rice and its absorption. Journal of Food Biochemistry 2009;33(2):176‐83. [Google Scholar]
Untoro 2006 {published data only}
- Untoro J, Schultink W, West CE, Gross R, Hautvast JG. Efficacy of oral iodized peanut oil is greater than that of iodized poppy seed oil among Indonesian schoolchildren. The American Journal of Clinical Nutrition 2006;84(5):1208‐14. [DOI] [PubMed] [Google Scholar]
van Stuijvenberg 2001 {published data only}
- Stuijvenberg M, Dhansay M, Smuts C, Lombard C, Jogessar V, Benadé A. Long‐term evaluation of a micronutrient‐fortified biscuit used for addressing micronutrient deficiencies in primary school children. Public Health Nutrition 2001;4(6):1201‐9. [DOI] [PubMed] [Google Scholar]
Additional references
Aguayo 2003
- Aguayo VM, Scott S, Ross J, PROFILES Study Group. Sierra Leone – investing in nutrition to reduce poverty: a call for action. Public Health Nutrition 2003;6(7):653‐7. [DOI] [PubMed] [Google Scholar]
Andersson 2007
- Andersson M, Benoist B, Delange F, Zupan J. Prevention and control of iodine deficiency in pregnant and lactating women and in children less than 2‐years‐old: conclusions and recommendations of the Technical Consultation. Public Health Nutrition 2007;10:1606‐11. [DOI] [PubMed] [Google Scholar]
Andersson 2012
- Andersson M, Karumbunathan V, Zimmerman MB. Global iodine status in 2011 and trends over the past decade. Journal of Nutrition 2012;142(4):744‐50. [DOI] [PubMed] [Google Scholar]
Angermayr 2004
- Angermayr L, Clar C. Iodine supplementation for preventing iodine deficiency disorders in children. Cochrane Database of Systematic Reviews 2004, Issue 2. [DOI: 10.1002/14651858.CD003819.pub2] [DOI] [PubMed] [Google Scholar]
Balshem 2011
- Balshem H, Helfanda M, Schünemann HJ, Oxmand AD, Kunze R, Brozek J, Vist GE, Falck‐Ytter Y, Meerpohl J, Norris S, Guyatt GH. GRADE guidelines: 3. Rating the quality of evidence. Journal of Clinical Epidemiology 2011;64(4):401‐6. [DOI: 10.1016/j.jclinepi.2010.07.015] [DOI] [PubMed] [Google Scholar]
Beaglehole 2012
- Beaglehole R, Bonita R, Horton R, Ezzati M, Bhala N, Amuyunzu‐Nyamongo M, et al. Measuring progress on NCDs: one goal and five targets. Lancet 2012;380(9850):1283‐5. [DOI: 10.1016/S0140-6736(12)61692-4] [DOI] [PubMed] [Google Scholar]
Bland 2015
- Bland M. Estimating mean and standard deviation from the sample size, three quartiles, minimum, and maximum. International Journal of Statistics in Medical Research 27 January 2015;4:57‐64. [Google Scholar]
Bleichrodt 1994
- Bleichrodt N, Born MP. A meta‐analysis of research on iodine and its relationship to cognitive function development. In: Stanbury JB editor(s). The damaged brain of iodine deficiency. New York: Cognizant Communication Corporation, 1994:195‐200. [Google Scholar]
Brown‐Grant 1961
- Brown‐Grant K. Enlargement of salivary gland in mice treated with isopropyl noradrenaline. Nature 1961;191:1076‐8. [Google Scholar]
Campbell 2012
- Campbell NR, Dary O, Cappuccio FP, Neufeld LM, Harding KB, Zimmermann MB. Need for coordinated programs to improve global health by optimizing salt and iodine intake. Revista Panamericana de Salud Publica 2012;32(4):281‐6. [DOI] [PubMed] [Google Scholar]
Chen 1984
- Chen BZ, Shi ZF, Li XT, Lu CZ, Hou MT, Yang SH, et al. A survey of endemic goitre and endemic cretinism in Heba village of Guizhou province. Chinese Journal of Endemic Diseases 1984;3(2):97‐102. [Google Scholar]
Cochrane PHG 2010
- Guide for developing a Cochrane Protocol. Cochrane Public Health Group, The Cochrane Collaboration 2010; Vol. Version 2.
Codex 1981a
- Codex Alimentarius. Codex for edible fats and oils not covered by individual standards (CODEX STAN 19‐1981 (Rev. 2‐1999)). www.codexalimentarius.org/ (accessed 04 January 2013).
Codex 1981b
- Codex Alimentarius. Codex standards for olive oils and olive pomace oils (CODEX STAN 33‐1981). www.codexalimentarius.org/ (accessed 04 January 2013).
Codex 1985a
- Codex Alimentarius. Codex standard for wheat flour (CODEX STAN 152‐1985). /www.codexalimentarius.org/ (accessed 04 January 2013).
Codex 1985b
- Codex Alimentarius. Codex standard for whole maize (corn) meal (CODEX STAN 154‐1985). www.codexalimentarius.org/ (accessed 04 January 2013).
Codex 1985c
- Codex Alimentarius. Codex standard for degermed maize (corn) meal and maize (corn) grits (CODEX STAN 155‐1985). www.codexalimentarius.org/ (accessed 04 January 2013).
Codex 1995
- Codex Alimentarius. Codex general standard for food additives (Codex STAN 192‐1995). www.codexalimentarius.org/ (accessed 04 January 2013).
Codex 1999a
- Codex Alimentarius. Codex standard for named vegetable oils (CODEX STAN 210‐1999). www.codexalimentarius.org/ (accessed 04 January 2013).
Codex 1999b
- Codex Alimentarius. Codex standard for sugars (CODEX STAN 212‐1999). www.codexalimentarius.org/ (accessed 04 January 2013).
Codex 1999c
- Codex Alimentarius. Codex standard for general standards for the use of dairy terms (CODEX STAN 206 ‐1999). www.codexalimentarius.org/ (accessed 04 January 2013).
Codex 2001
- Codex Alimentarius. Codex standard for bouillon and consommes (CODEX STAN 117‐1981, Rev. 2‐2001). www.codexalimentarius.org/ (accessed 04 January 2013).
Codex 2005
- Codex Alimentarius. Codex general standard for fruit juices and nectars (CODEX STAN 247‐2005). www.codexalimentarius.org/ (accessed 04 January 2013).
Delong 1997
- DeLong GR, Leslie PW, Wang SH, Jiang XM, Zhang ML, Rakeman M, et al. Effect of infant mortality of iodination of irrigation water in a severely iodine‐deficient area of China. Lancet 1997;350(9080):771‐3. [DOI] [PubMed] [Google Scholar]
DerSimonian 1986
- DerSimonian R, Laird N. Meta‐analysis in clinical trials. Controlled Clinical Trials 1986 September;7(3):177‐88. [DOI] [PubMed] [Google Scholar]
Elnagar 1997
- Elnagar B, Eltom M, Karlsson FA, Bourdoux PP, Gebre‐Medhin M. Control of iodine deficiency using iodination of water in a goitre endemic area. International Journal of Food Sciences and Nutrition 1997;48:119‐27. [DOI] [PubMed] [Google Scholar]
EPOC 2015
- Effective Practice, Organisation of Care (EPOC). Suggested risk of bias criteria for EPOC reviews. EPOC Resources for review authors. Oslo: Norwegian Knowledge Centre for the Health Services; 2015. epoc.cochrane.org/epoc‐specific‐resources‐review‐authors (accessed 25 February 2016).
Fong 1981
- Fong RJ, Jiang XM, Su MY. Relationship of endemic goitre epidemic characteristics and geological structure characteristics in Xinjiang Province. Chinese Journal of Preventive Medicine 1981;15(2):65‐8. [Google Scholar]
FSANZ 2012
- FSANZ. Iodine fortification. www.foodstandards.gov.au/consumer/nutrition/iodinefort/Pages/default.aspx (accessed September 2014).
GRADEpro GDT 2015 [Computer program]
- McMaster University (developed by Evidence Prime). GRADEpro GDT. Version accessed June 2018. Hamilton (ON): McMaster University (developed by Evidence Prime), 2015.
Haas 2006
- Haas J, Miller D. Symposium of food fortification in developing countries. Journal of Nutrition 2006;136:1053‐4. [Google Scholar]
Hetzel 1983
- Hetzel BS. Iodine deficiency disorders (IDD) and their eradication. Lancet 1983;322(8359):1126‐9. [DOI] [PubMed] [Google Scholar]
Higgins 2011
- Higgins JPT, Green S, editors. Cochrane Handbook for Systematic Reviews of Interventions Version 5.1.0 (updated March 2011). The Cochrane Collaboration, 2011. Available from handbook.cochrane.org.
Hozo 2005
- Hozo SP, Djulbegovic B, Hozo I. Estimating the mean and variance from the median, range, and the size of a sample. BMC Medical Research Methodology 20 April 2005;5(13):10. [DOI] [PMC free article] [PubMed] [Google Scholar]
Killip 2004
- Killip S, Mabfoud Z, Pearce K. What is intracluster correlation coefficient? Crucial concepts for primary care researchers. Annals of Family Medicine 2004;2(3):204‐8. [DOI] [PMC free article] [PubMed] [Google Scholar]
Land 2013
- Land MA, Christoforou A, Downs S, Webster J, Billot L, Li M, et al. Iodine fortification of foods and condiments, other than salt, for preventing iodine deficiency disorders. Cochrane Database of Systematic Reviews 2013, Issue 9. [DOI: 10.1002/14651858.CD010734] [DOI] [PMC free article] [PubMed] [Google Scholar]
Li 1997
- Li SM, Wang RY, Lu B, Rao FG, Gao LD, Zhang YH, et al. Dynamic studies of iodised salt and iodised oil on iodine metabolism of pregnant women in IDD areas. Chinese Journal of Endemic Diseases 1997;16(4):229‐33. [Google Scholar]
Li 2006
- Li M, Eastman C, Waite K, Ma G, Zacharin MR, Topliss DJ, et al. Are Australian children iodine deficient? Results of the Australian National Iodine Nutrition Study. Medical Journal of Australia 2006;184(4):165‐9. [DOI] [PubMed] [Google Scholar]
Li 2012
- Li M, Eastman C. The changing epidemiology of iodine deficiency. Nature Reviews – Endocrinology April 2012;8(7):434‐40. [DOI] [PubMed] [Google Scholar]
Lin 1995
- Lin FF, Zhao HX, Sha NY, Yi LXT, Jiang JY, Yang CZ, et al. A study for fetus development during pregnancy in areas of iodine deficiency. Chinese Journal of Endemic Diseases 1995;14(2):91‐3. [Google Scholar]
Lozano 2012
- Lozano R, Naghavi M, Foreman K, Lim S, Shibuya K, Aboyans V, et al. Global and regional mortality from 235 causes of death for 20 age groups in 1990 and 2010: a systematic analysis for the Global Burden of Disease Study 2010. Lancet 2012;380(9859):2095‐128. [DOI] [PMC free article] [PubMed] [Google Scholar]
Lv 2009
- Lv SM, Xie LJ, Zhou RH, Chong ZS, Jia LH, Jing MA, et al. Control of iodine deficiency disorders following 10‐year universal salt iodization in Hebei province of China. Biomedical and Environmental Sciences 2009;22(6):472‐9. [DOI] [PubMed] [Google Scholar]
Mahomed 2006
- Mahomed K, Gülmezoglu AM. Maternal iodine supplements in areas of deficiency. Cochrane Database of Systematic Reviews 2006, Issue 3. [DOI: 10.1002/14651858.CD000135.pub2] [DOI] [PMC free article] [PubMed] [Google Scholar]
Mantel 1959
- Mantel N, Haenszel W. Statistical aspects of the analysis of data from retrospective studies of disease. Journal of the National Cancer Institute 1959;22:719‐48. [PubMed] [Google Scholar]
Nazeri 2010
- Nazeri P, Mirmiran P, Mehrabi Y, Hedayati M, Delshad H, Azizi F. Evaluation of iodine nutritional status in Tehran, Iran: iodine deficiency within iodine sufficiency. Thyroid 2010;20(12):1399‐406. [DOI] [PubMed] [Google Scholar]
Pennington 1990
- Pennington J. A review of iodine toxicity reports. Journal of the American Dietetic Association 1990;11:1571‐81. [PubMed] [Google Scholar]
Ramakrishnan 2002
- Ramakrishnan U. Prevalence of micronutrient malnutrition worldwide. Nutrition Reviews 2002;60(5):S46‐52. [DOI: 10.1301/00296640260130731] [DOI] [PubMed] [Google Scholar]
RevMan 2014 [Computer program]
- Nordic Cochrane Centre, The Cochrane Collaboration. Review Manager 5 (RevMan 5). Version 5.1. Copenhagen: Nordic Cochrane Centre, The Cochrane Collaboration, 2014.
Roti 2001
- Roti E, Uberti E. Iodine excess and hyperthyroidism. Thyroid 2001;11(5):493‐500. [DOI] [PubMed] [Google Scholar]
Sukuzi 2011
- Suzuki S, Shingematsu S, Inada H, Takei M, Takeda T, Komastsu M. Pituitary resistance to thyroid hormones: pathophysiology and therapeutic options. Endocrine 2011;40(3):366‐71. [DOI: 10.1007/s12020-011-9538-2] [DOI] [PubMed] [Google Scholar]
The Micronutrient Initiative 2011
- The Micronutrient Initiative (MI). Annual Report 2010‐2011. www.micronutrient.org/CMFiles/MI‐AnnualReport1011‐EN‐web.pdf (accessed 04 January 2013).
Todd 1999
- Todd CH. Hyperthyroidism and Other Thyroid Disorders: A Practical Handbook for Recognition and Management. Geneva: World Health Organization, 1999. [Google Scholar]
UNICEF 2012
- UNICEF. The state of the world’s children 2012: children in an urban world. www.unicef.org/sowc2012/index.php (accessed 04 January 2013).
Vanderpump 2011
- Vanderpump MP, Lazarus JH, Smyth PP, Laurberg P, Holder RL, Boelaert K, et al. British Thyroid Association UK Iodine Survey Group. Iodine status of UK schoolgirls: a cross‐sectional survey. Lancet 2011;377(9782):2007‐12. [DOI: 10.1016/S0140-6736(11)60693-4] [DOI] [PubMed] [Google Scholar]
Watts 2012
- Watts C, Cairncross S. Should the GBD risk factor rankings be used to guide policy?. Lancet 2012;380(9859):2060‐1. [DOI: 10.1016/S0140-6736(12)62121-7] [DOI] [PubMed] [Google Scholar]
WHO 1996
- World Health Organization. Recomended iodine levels in salt and guidelines for monitoring their adequacy and effectiveness. whqlibdoc.who.int/hq/1996/WHO_NUT_96.13.pdf (accessed 04 January 2013).
WHO 2002
- World Health Organization. The World Health Report 2002 ‐ Reducing Risks, Promoting Healthy Life. Geneva, Switzerland: World Health Organization, 2002. [Google Scholar]
WHO 2006
- World Health Organization and Food and Argriculture Organization. Guidelines on Food Fortification with Micronutrients. Gevena, Switzerland: World Health Organization, 2006. [Google Scholar]
WHO 2007a
- WHO, UNICEF, ICCIDD. Assessment of Iodine Deficiency Disorders and Monitoring their Elimination. 3rd Edition. Geneva, Switzerland: World Health Organization, 2007. [Google Scholar]
WHO 2007b
- World Health Organization. Reducing Salt Intake in Populations. Geneva, Switzerland: World Health Organization, 2007. [Google Scholar]
WHO 2007c
- Andersson M, Benoist B, Delange F, Zupan J, WHO Secretariat. Prevention and control of iodine deficiency in pregnant and lactating women and in children less than 2‐years‐old: conclusions and recommendations of the Technical Consultation. Public Health Nutrition 2007;10(12A):1606‐11. [DOI] [PubMed] [Google Scholar]
WHO 2008
- World Health Organization. Salt as a vehicle for fortification. apps.who.int/iris/bitstream/handle/10665/43908/9789241596787_eng.pdf?ua=1 (accessed January 2013).
WHO 2014
- Aburto N, Abudou M, Candeias V, Wu T, WHO. Effect and safety of salt iodization to prevent iodine deficiency disorders: a systematic review with meta‐analyses. apps.who.int/iris/bitstream/handle/10665/148175/9789241508285_eng.pdf?sequence=1 (accessed June 2018).
WHO 2014a
- World Health Organization. Guideline: fortification of food‐grade salt with iodine for the prevention and control of iodine deficiency disorders. apps.who.int/iris/bitstream/handle/10665/136908/9789241507929_eng.pdf?sequence=1&isAllowed=y (accessed June 2018). [PubMed]
WHO/CDC 2011
- World Health Organization, Centers for Disease Control and Prevention. Logic model for micronutrient interventions in public health. www.who.int/vmnis/toolkit/WHO‐CDC‐english_colour.pdf (accessed 31 January 2013).
WHO/FAO 2006
- Allen L, Benoist B, Dary O, Hurrell R, editor(s), World Health Organization, Food, Agriculture Organization of the United Nations. Guidelines on Food Fortification with Micronutrients. Geneva, Switzerland: World Health Organization, 2006. [Google Scholar]
Winger 2008
- Winger R, Konig J, House D. Technological issues associated with iodine fortification of foods. Trend in Food Science and Technology 2008;19(2):94‐101. [Google Scholar]
World Bank
- World Bank. Country and lending groups. data.worldbank.org/about/country‐and‐lending‐groups (accessed July 2018).
Wu 2002
- Wu T, Abudou M, Aburto NJ, Candeias V. Iodised salt for preventing iodine deficiency disorders. Cochrane Database of Systematic Reviews 2002, Issue 3. [DOI: 10.1002/14651858.CD003204] [DOI] [PMC free article] [PubMed] [Google Scholar]
Zimmerman 2008
- Zimmerman M, Jooste P, Pandav C. Iodine‐deficiency disorders. Lancet 2008;372(9645):1251‐62. [DOI: 10.1016/S0140-6736(08)61005-3] [DOI] [PubMed] [Google Scholar]
Zimmerman 2009
- Zimmerman M. Iodine deficiency. Endocrine Reviews 2009;30(4):376‐408. [DOI: 10.1210/er.2009-0011] [DOI] [PubMed] [Google Scholar]
Zimmerman 2010
- Zimmerman M. Symposium on geographical and geological influences on nutrition: iodine deficiency in industrialised countries. The Proceedings of the Nutrition Society 2010;69(1):133‐43. [DOI] [PubMed] [Google Scholar]