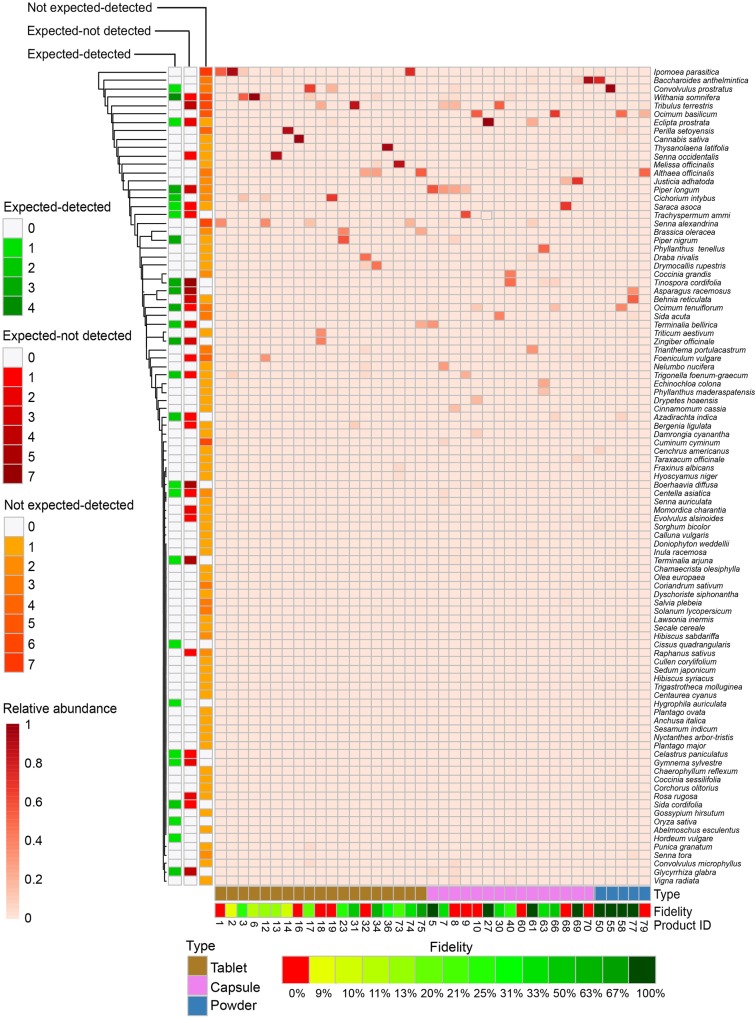
FIGURE 3.
Detection of species in Ayurvedic herbal products. Species (y-axis) are colored by relative abundance of normalized read numbers. Species are categorized in expected-detected and not expected-detected, based on the total number of occurrences, whereas the category expected-not detected is based on the number of times that the species is expected but not detected. Species are clustered by Euclidean distances. Ayurvedic samples (x-axis) are numbered with product code and grouped by product type.

