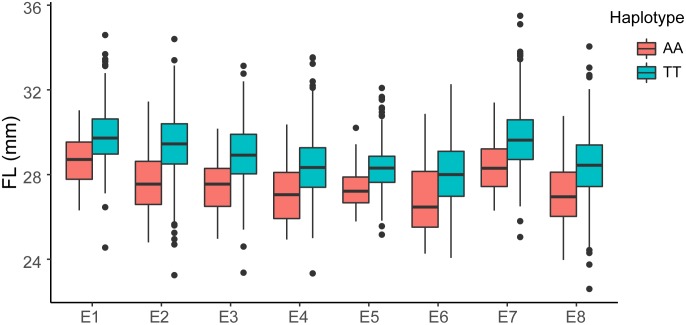
FIGURE 3.
Box plots of FL based on the haplotypes of two SNPs (AA, n = 52 and TT, n = 262) on chromosome D03 in eight environments (E1: AY-2014, E2: AY-2015, E3: AY-2016, E4: SHZ-2014, E5: SHZ-2015, E6: SHZ-2016, E7: HG-2016, and E8: SY-2016). The significance of the difference was analyzed with two-tailed Student’s t-tests.

