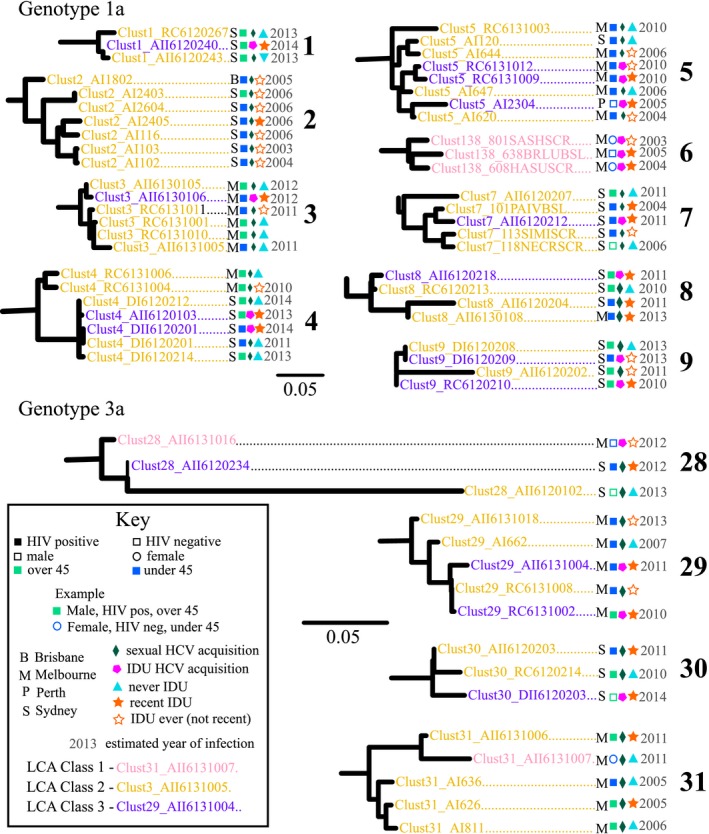
Figure 2. Clusters from maximum likelihood phylogenetic trees, constructed with sequences from Core‐E2 region of hepatitis C virus (HCV) obtained from people with recent infection in Australia between 2004 and 2015 (full trees in Figure S1).

All identified clusters at <5% mean maximum genetic distance cutoff are displayed (genotype 1a numbered #1 to 9 and genotype 3a numbered #28 to 31). Scale bars indicate nucleotide substitutions per site. Tip names are coloured by latent class analysis (LCA) highest posterior probability classes (Class 1: PWID; Class 2: HIV‐positive GBSM or Class 3: GBSM with injecting drug use (IDU)). Numbers at tips represent estimated year of infection for each participant (if available) and letters represent the city where participants were recruited. Squares represent males, circles females, filled circles or squares represent a participant with HCV/HIV co‐infection, empty circles or squares represent HCV mono‐infection, and light green represents participants who are over 45 years of age, with blue representing under 45 years of age. Small diamonds represent participants who acquired HCV infection sexually, with pentagons representing IDU acquisition. A triangle represents participants never reporting IDU, an empty star represents reporting IDU ever but not recently and a filled star represents reporting recent IDU.
