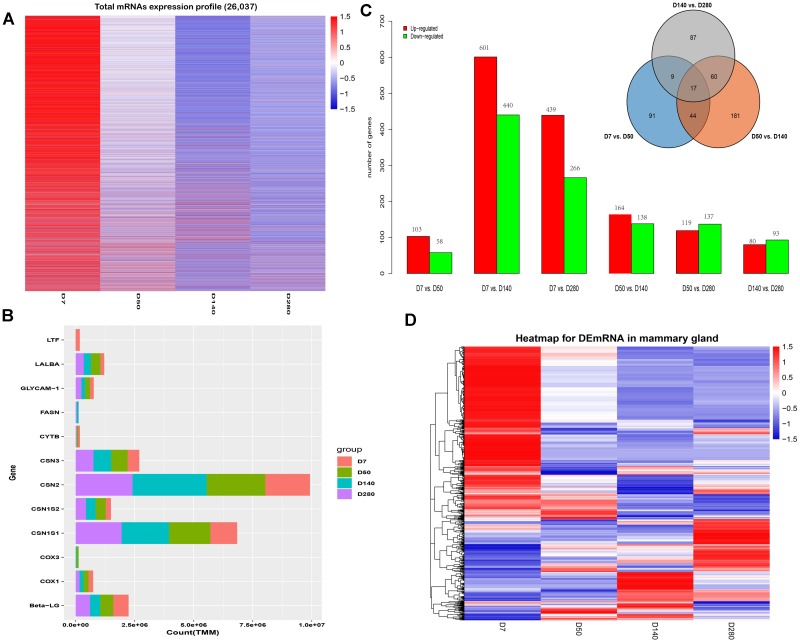
FIGURE 1.
Expression profiles of buffalo mammary gland tissues during four lactation point. (A) The cluster heat map of all mRNAs expression at different stages during lactation. (B) Bar plots are showing top10 genes with highest TPM values across the four points. (C) Bar plots showing differentially expressed genes by the pairwise comparison. (D) Hierarchical clustering is showing often up and down-regulated mRNAs across the four points.

