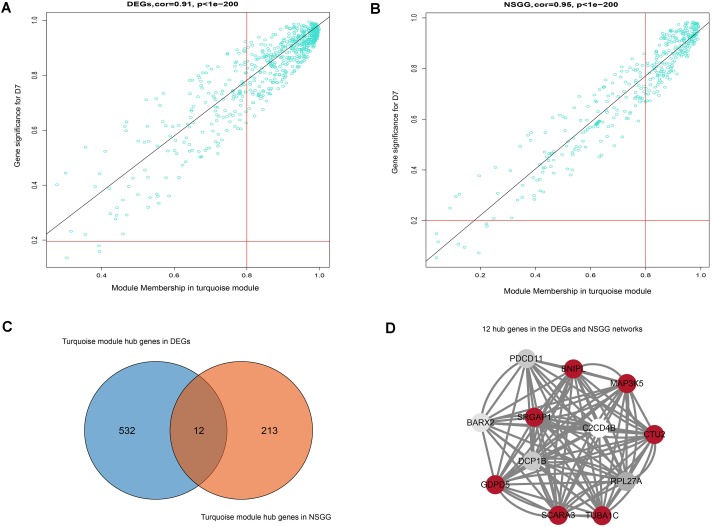
FIGURE 5.
Hub genes detection and network construction analysis. (A) Scatter plot of module eigengenes in the turquoise module from DEGs dataset. (B) Scatter plot of module eigengenes in the turquoise module from NSGG dataset. (C) The Venn diagram of the DEGs and NSGG hub genes. (D) Hub gene interaction network of in the turquoise module from the DEGs and NSGG dataset. The color intensity in each node was proportional to the TOM values calculated by WGCNA (the higher TOM values were in a circle with red, whereas the lower TOM values were in a circle with white).

