
Figure 2.
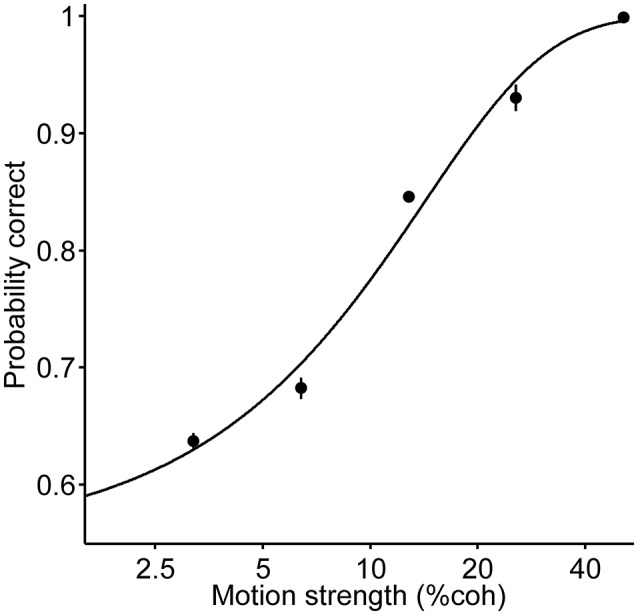
Psychometric function of all the trials; each data point presents the performance of pooled data for all the three durations and two directions. The curve is the fit of a logistic regression to the data (Equation 1). Error bars indicate SE (Standard Error).