
Figure 4.
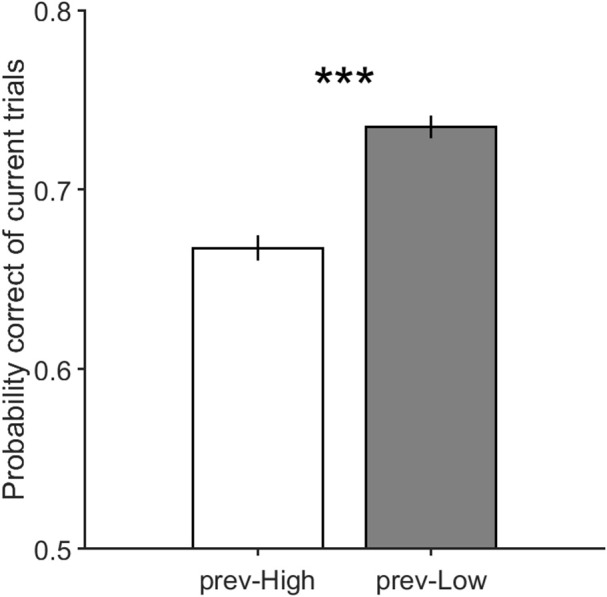
The performance of the current trials which includes motion strengths of 3.2, 6.4, and 12.8% when their previous trials have high motion strengths of 12.8, 25.6, and 51.2% in prev-High, and have low motion strengths of 0 and 3.2% in prev-Low. Error bars indicate SE (Standard Error). Wilcoxon rank-sum test is used to test the significance of the difference, ***p < 1E−3.