
Figure 1.
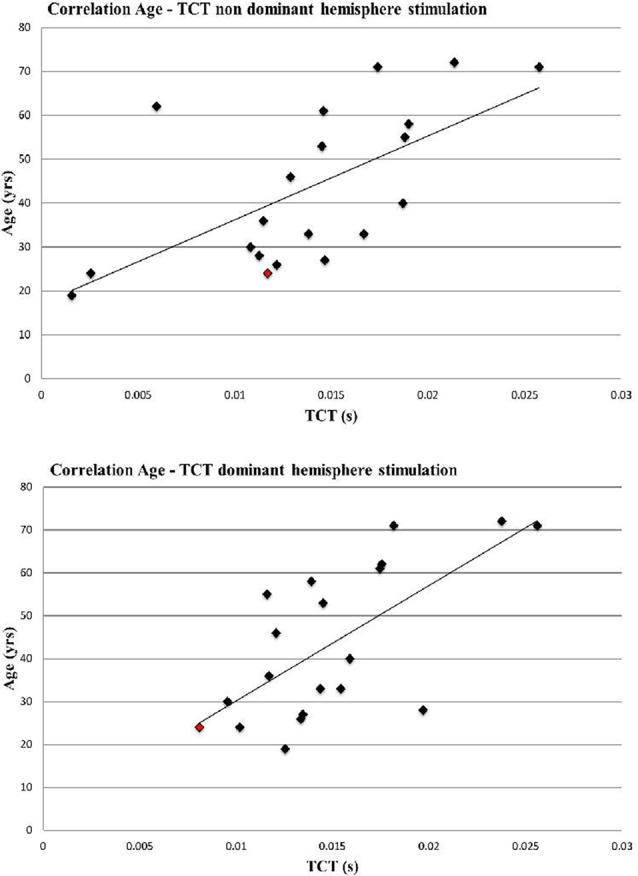
Correlation Age and transcallosal conduction time (TCT) of non-dominant and dominant hemisphere stimulation (non-dominant hemisphere stimulation: r = 0.63, p < 0.01; dominant hemisphere stimulation: r = 0.67 p < 0.01). Left handed participant is marked in red.