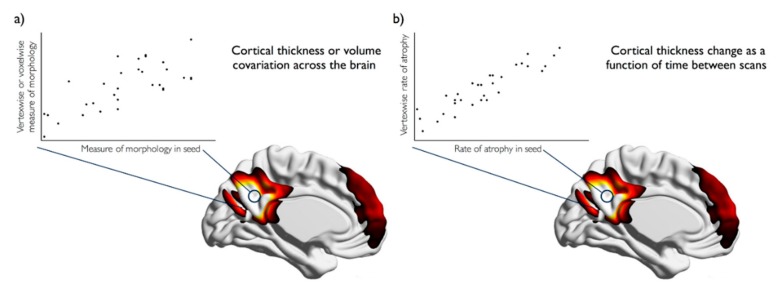
Figure 1.
Hypothetical, illustrative examples of (a) structural covariance and (b) atrophic covariance of the default mode network. (a) In structural covariance, volume or cortical thickness in a posterior cingulate seed (circle shape) is compared to volume or cortical thickness with the rest of the brain on a voxel- or vertex-wise basis and at a group level; (b) In atrophic covariance, the rate of atrophy in the posterior cingulate region (circle shape) is compared with the rate of atrophy in the rest of the brain on a voxel- or vertex-wise basis and at a group level. Colour spectrum represents strength of correlation, with lighter colours reflecting higher correlation values.

