Figure 2.
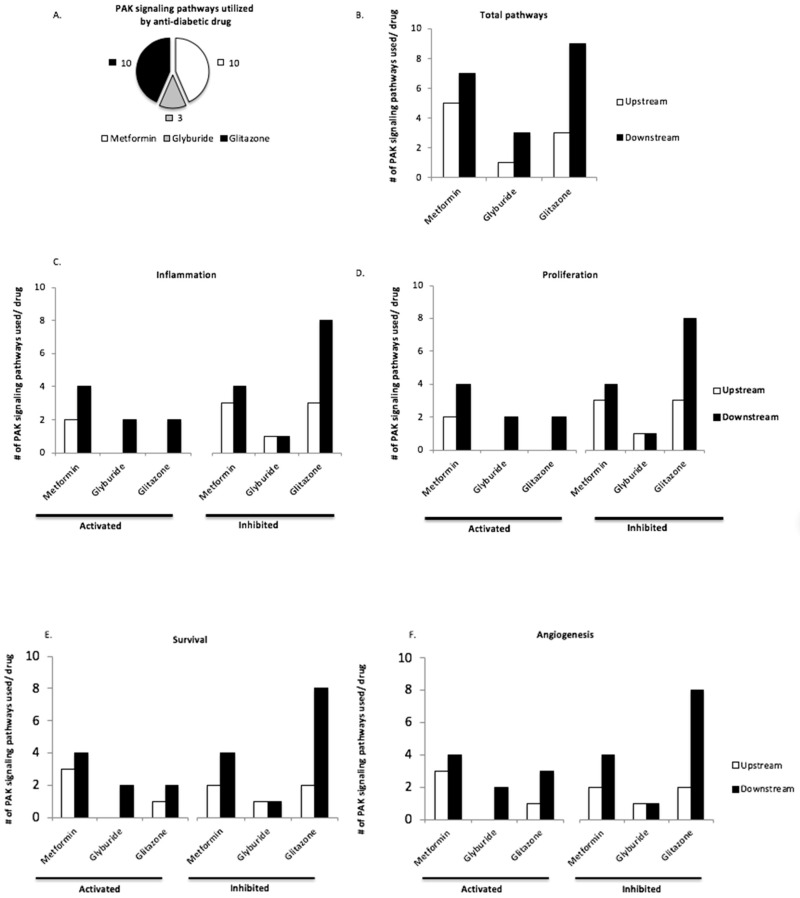
(A–F) Anti-diabetic drugs utilize upstream and downstream PAK signaling pathways. (A) Pie graph indicates total number of PAK signaling pathways utilized by metformin, glyburide, or glitazone. (B) Total number of pathways utilized by anti-diabetic drugs upstream or downstream of PAK. Note that total number of pathways in (A,B) are not equal as pathways interfered by drug may involve targets both up and downstream PAK. All bar graphs indicate the number of PAK signaling pathways involved in inflammation (C), proliferation (D), survival (E), and angiogenesis (F) upstream or downstream of PAK, which are either activated or inhibited by anti-diabetic drugs. See text for statistics.

