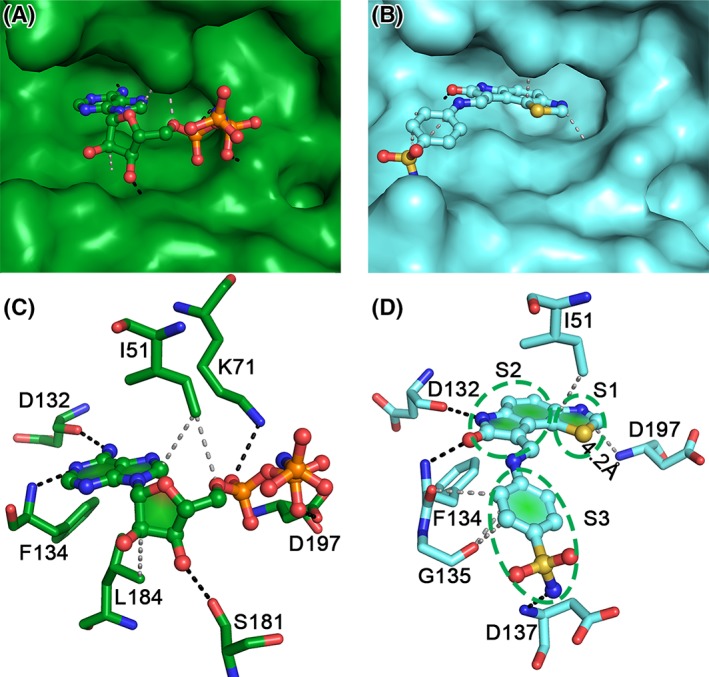
Figure 4.

Comparison of AMP‐PNP (green) and inhibitor (GW297361X; cyan) bound VRK1 structures. Surface representation showing the docking of AMP‐PNP (A) and inhibitor (B) in the VRK1‐active site pocket. The P‐loop has been removed in the inhibitor bound structure (B) for clarity. It is visible that the inhibitor (B) sits deeper in comparison to AMP‐PNP (A). The hydrogen bonds and non‐polar contacts made by AMP‐PNP (C) and the inhibitor (D) are indicated by black and gray broken lines, respectively. The interactions can be categorized based on the three moieties (denoted by S1, S2, and S3) in the inhibitor. The thiazole moiety (S1) nitrogen is ~4 Å from the Asp197 backbone (B), while an equivalent region in AMP‐PNP is missing. The oxindole ring (S2) mimics the interactions made by the adenosine ring in AMP‐PNP, with Ile51, Asp132, and Phe134. The benzene sulfonamide moiety (S3) of the inhibitor is replaced by the ribose and phosphate groups in AMP‐PNP and is stabilized by more interactions than the inhibitor.
