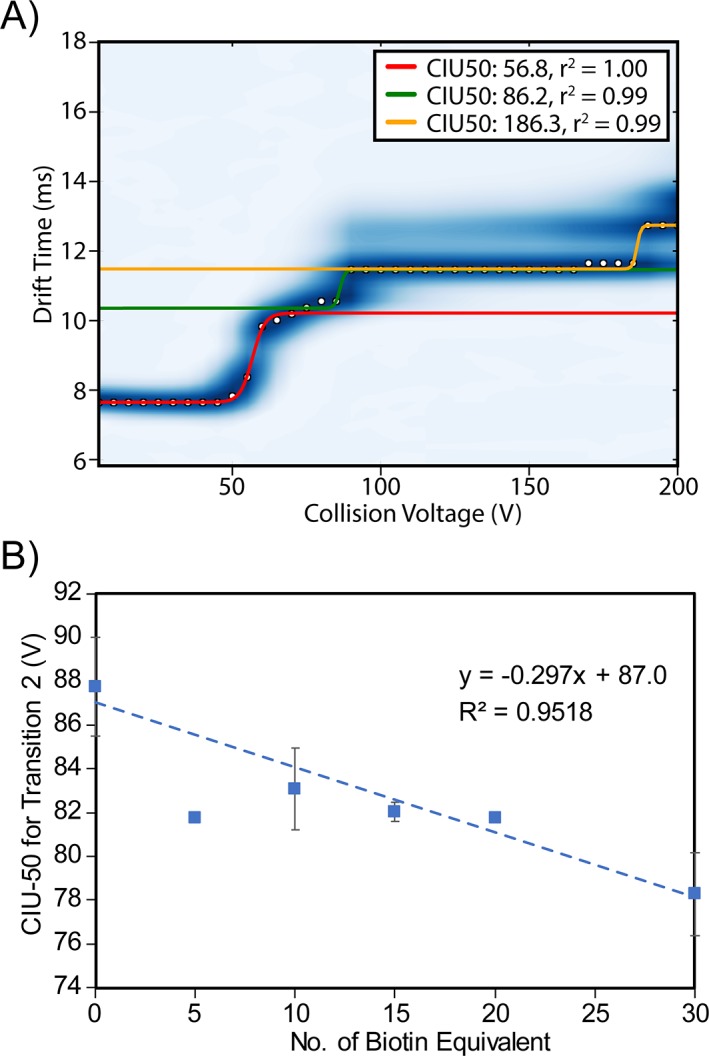
Figure 5.

(A) A representative CIU fingerprint for the parent mAb with three gas‐phase unfolding transitions fitted. Our analysis is focused on the first two transitions, highlighted as red and green lines respectively. (B) Collision voltage required for the second CIU transition plotted against the number of biotin equivalent. Each data point is the average value from triplicate data. An initial linear regression was performed and the studentized deleted residuals (r i) were calculated to detect outliers. Data point for 5 eqv. biotin was identified as an outlier, as |r| = 3.732 > t 0.975 (df = 3). The trendline shown in this figure was fitted based on the dataset omitting the outlier.
